Unions spent the first half of the 20th century transforming a massive industrial peasantry into the American middle class. In the second half of the 20th century, big business fought back by pressing for so-called “right-to-work” laws, which dilute the influence of labor unions.
To determine which states are the most unionized, Stacker looked at BLS data for 2020 (released in January 2021) and ranked each state according to its percentage of wage and salary workers who were members of labor unions.
Not surprisingly, the issue is politically polarized. Republicans overwhelmingly back right-to-work laws, and Democrats overwhelmingly side with their historic allies in labor. In fact, a red/blue map of the right-to-work states versus pro-union states looks nearly identical to that of the Electoral College.
Today, 27 states enforce right-to-work laws. These free-rider statutes extend the gains of union-won collective bargaining agreements to non-union workers who didn’t join or pay dues themselves. Predictably and as intended, many workers simply opt to piggyback instead of pitching in, which causes union membership and the influence of organized labor to dwindle. Big business prefers divided labor over organized labor for a reason. According to the Bureau of Labor Statistics (BLS), the median weekly wage for union members in the United States is $1,144 vs. $958 for nonunion workers.
In 2020, union membership stood at about 10.8% of the U.S. workforce. That’s a little more than half of the 20.1% that existed when BLS began tracking it in 1983. Three decades before that, in 1953, more than one in three private-sector workers were union members. Today, that number has dwindled to just 6.3%. Right-to-work legislation is decided at the state level, so the country’s remaining union members are not spread out evenly.
Keep reading to see which states are the most unionized.
1 / 51Khanrak // Wikimedia Commons
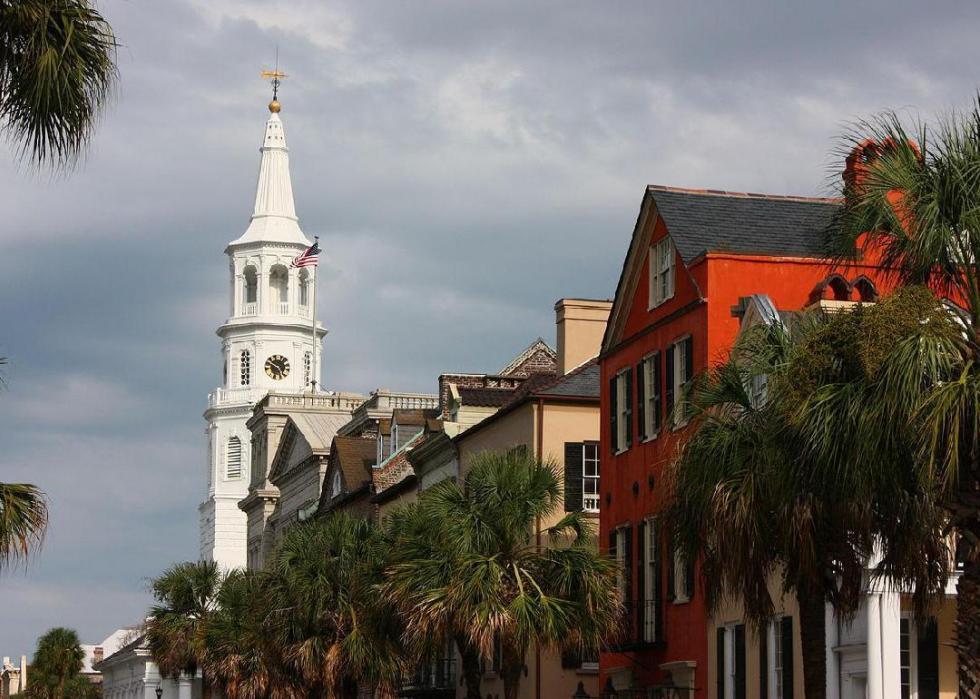
#51. South Carolina
– Employed population: 2.0 million
– Members of unions: 59,000 (2.9% of employed population)
– Workers represented by unions: 77,000 (3.8% of employed population)
No stranger to the bottom of the list, South Carolina once again takes the title of America’s least unionized state. The state’s workforce is growing quickly and union membership is not, though it did improve slightly from 2019.

2 / 51James Willamor // Flickr
#50. North Carolina
– Employed population: 4.1 million
– Members of unions: 129,000 (3.1% of employed population)
– Workers represented by unions: 161,000 (3.9% of employed population)
In the years when South Carolina isn’t the least-unionized state, its neighbor to the north often is. North Carolina became a right-to-work state in 1947, making it one of the early adopters of the movement. The right-to-work agenda emerged in the South after World War II, as integrated labor unions began threatening both the economic power structure and the racial power structure in the region.
3 / 51Pasteur // Wikimedia Commons
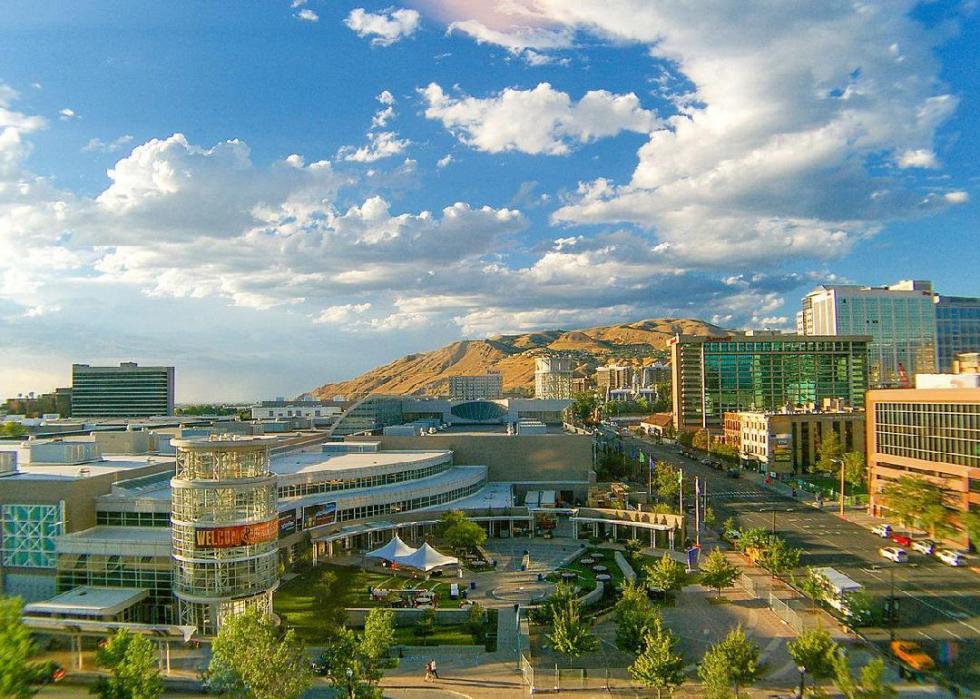
#49. Utah
– Employed population: 1.4 million
– Members of unions: 51,000 (3.7% of employed population)
– Workers represented by unions: 75,000 (5.4% of employed population)
In 1955, Utah became the 18th state to join the right-to-work coalition—one of the first states to do so outside of the South. This dynamic, according to the Utah History Encyclopedia, is directly connected to organized labor’s long history of conflict with the Mormon church.
4 / 51Sopotnicki // Shutterstock
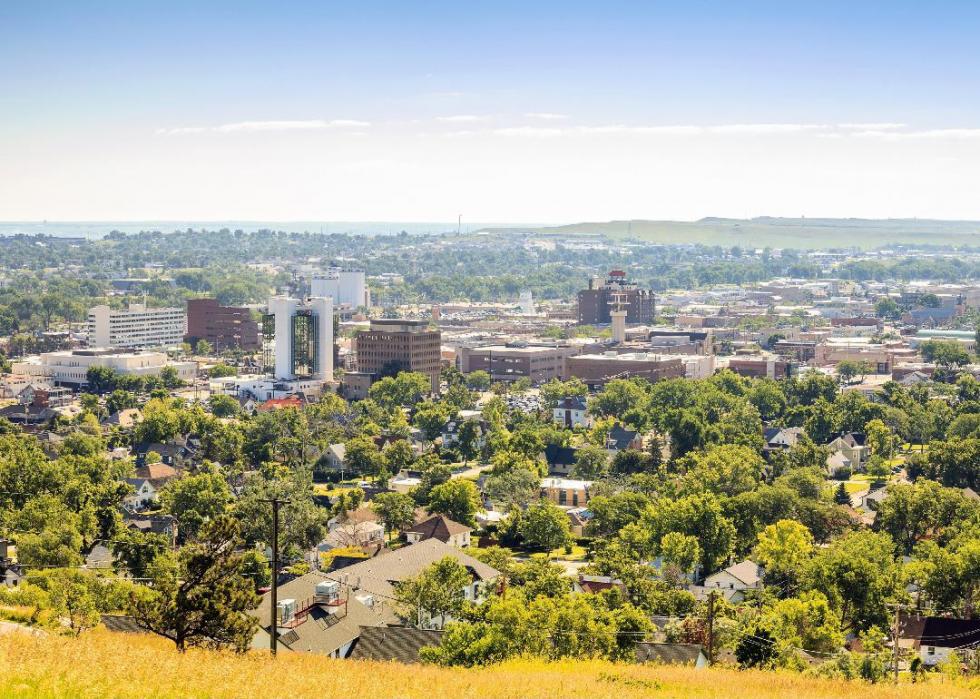
#48. South Dakota
– Employed population: 385,000
– Members of unions: 17,000 (4.3% of employed population)
– Workers represented by unions: 21,000 (5.5% of employed population)
Back in 2003, the Rapid City Journal ran an article under the headline “Unions Waning in South Dakota.” There were just 19,000 union members left in the state by 2002, down from 21,000 in 1997. Overall membership has continued to decline.
5 / 51Sean Pavone // Shutterstock
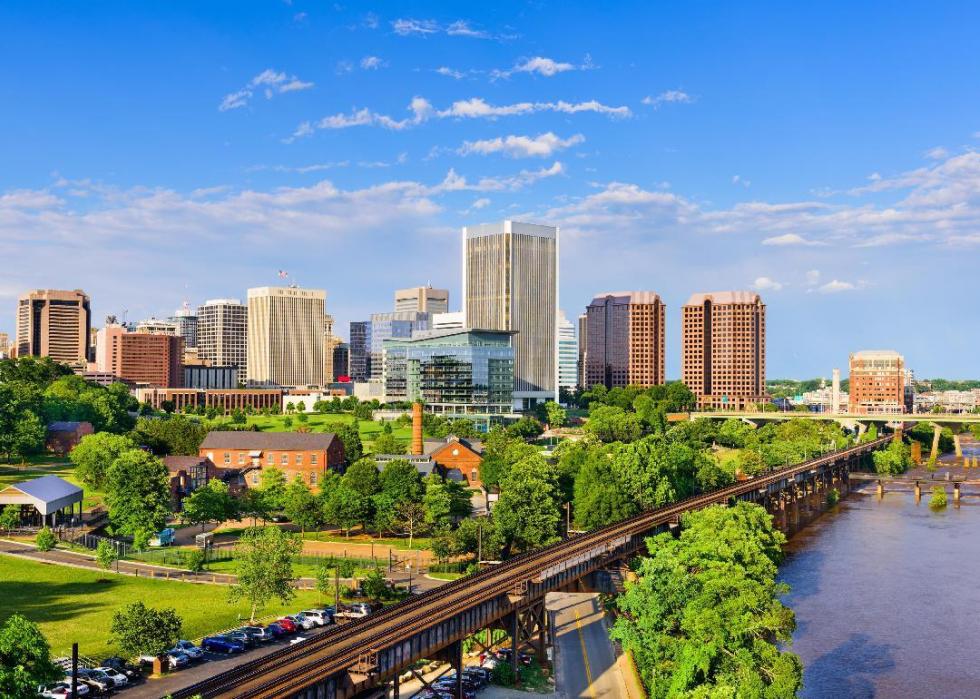
#47. Virginia
– Employed population: 3.7 million
– Members of unions: 164,000 (4.4% of employed population)
– Workers represented by unions: 201,000 (5.4% of employed population)
Although the 2020 election saw Democrats flip Virginia, the state is still part of the South, where the modern anti-labor movement was born. Despite the change in leadership, Virginia’s right-to-work laws have thus far proven too deeply entrenched for progressives in the state to uproot.
6 / 51Sean Pavone // Shutterstock
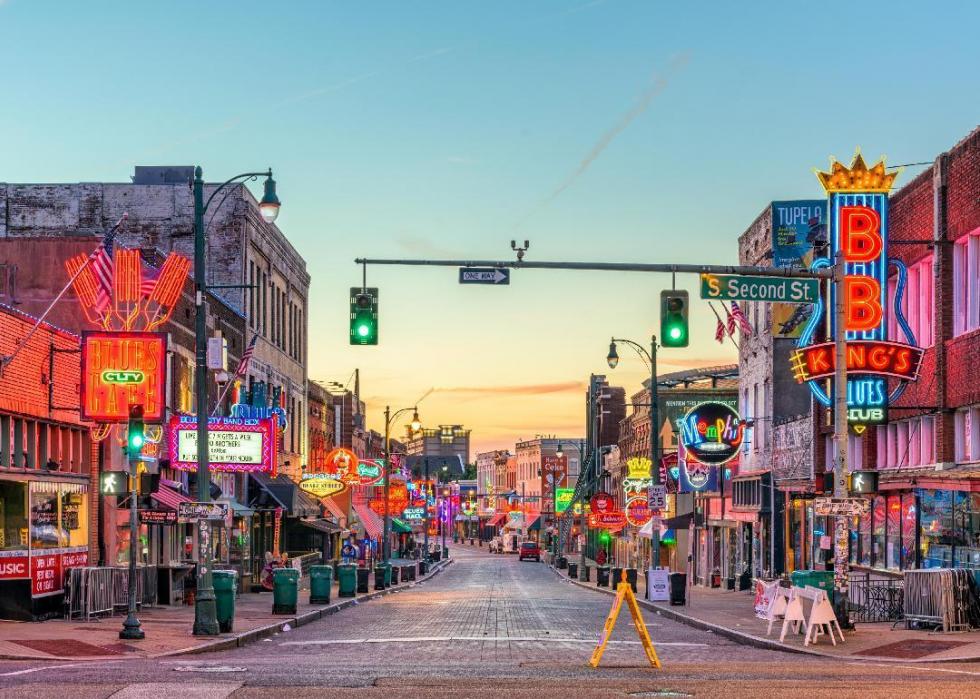
#46. Tennessee
– Employed population: 2.7 million
– Members of unions: 117,000 (4.4% of employed population)
– Workers represented by unions: 137,000 (5.1% of employed population)
Tennessee is part of America’s right-to-work stronghold in the South, where union membership has dwindled to less than 5% of the workforce. In 2020, state leadership proposed an amendment enshrining right-to-work language in the Tennessee constitution.
7 / 51Brett Barnhill // Shutterstock
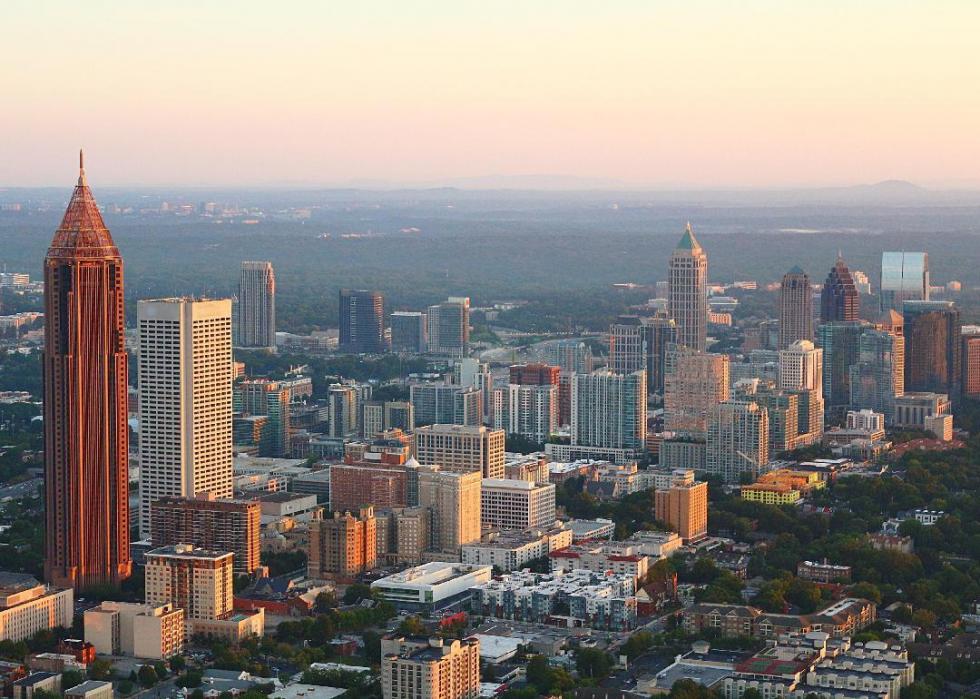
#45. Georgia
– Employed population: 4.2 million
– Members of unions: 194,000 (4.6% of employed population)
– Workers represented by unions: 271,000 (6.5% of employed population)
In 2016, labor leaders in Georgia cheered as a judge overruled a state law designed to dilute the influence of unions there even further. Despite that narrow victory, Georgia remains committed to protecting its well-earned image as a pro-business state, a status often won at the expense of its workers.
8 / 51W. Scott McGill // Shutterstock
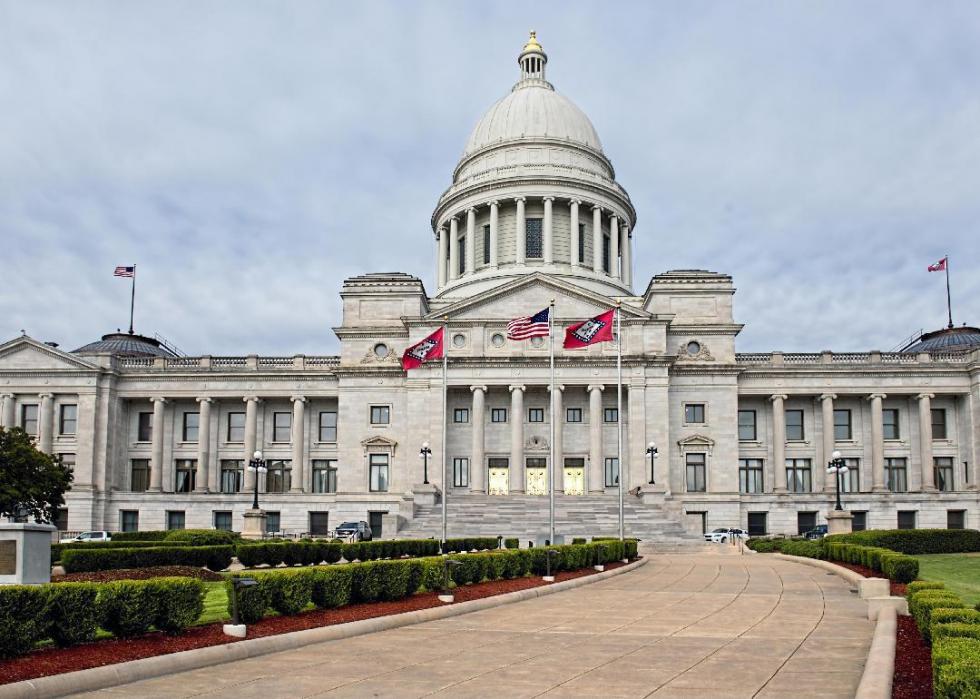
#44. Arkansas
– Employed population: 1.2 million
– Members of unions: 55,000 (4.7% of employed population)
– Workers represented by unions: 69,000 (5.9% of employed population)
In 2018, a local CBS affiliate reported that union membership was on the rise in Arkansas, despite the state ranking above only 12 other states in terms of current unionization. Now, three years after the supposed boost, Arkansas has dropped even further—behind all but seven other states.
9 / 51Ryan Conine // Shutterstock
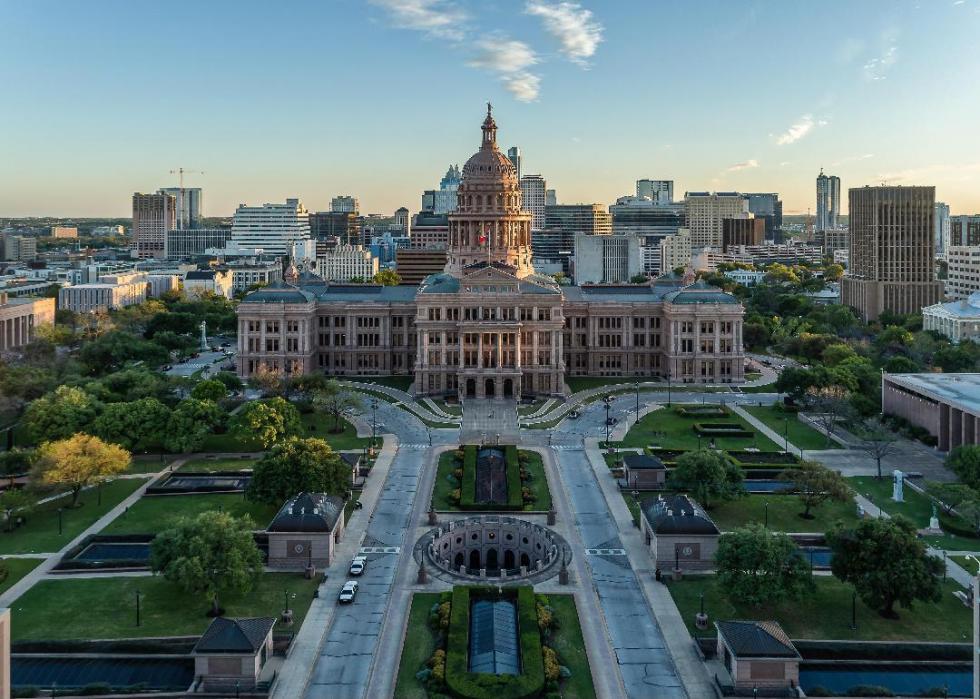
#43. Texas
– Employed population: 11.6 million
– Members of unions: 563,000 (4.9% of employed population)
– Workers represented by unions: 693,000 (6.0% of employed population)
The term “right to work” was coined by anti-labor oil industry chiefs in Houston in 1936, and no state has been more central to the movement. After World War II, Houston businessman and vocal white supremacist Vance Muse founded the Christian American Association. Through the organization, he leveraged contemporary fears to successfully link unions with both integration and communism in the public imagination, while crafting the first right-to-work laws in Texas.
10 / 51Andrew Zarivny // Shutterstock
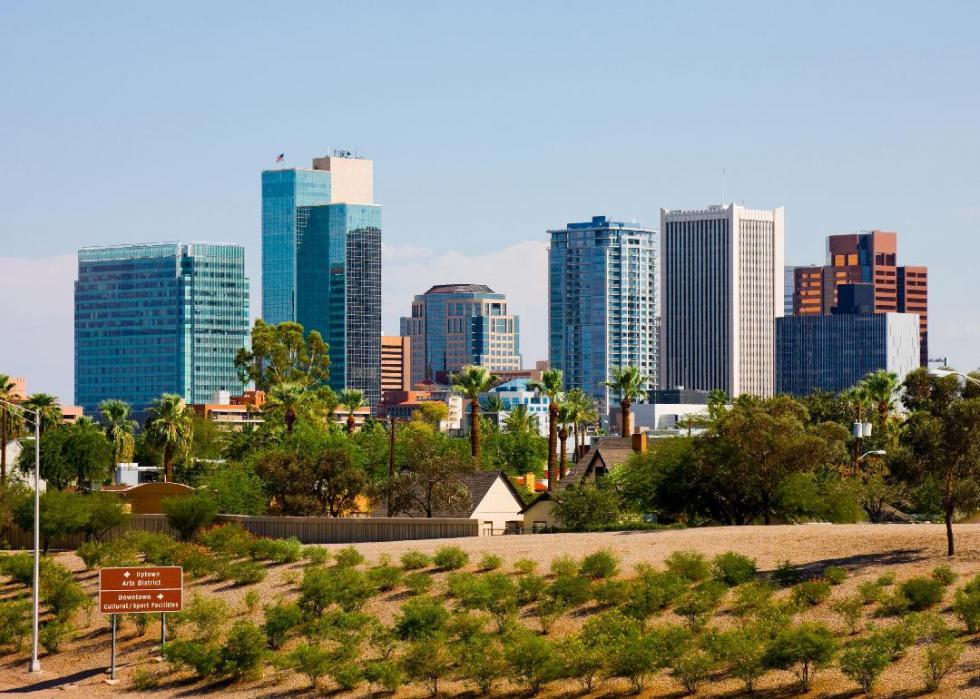
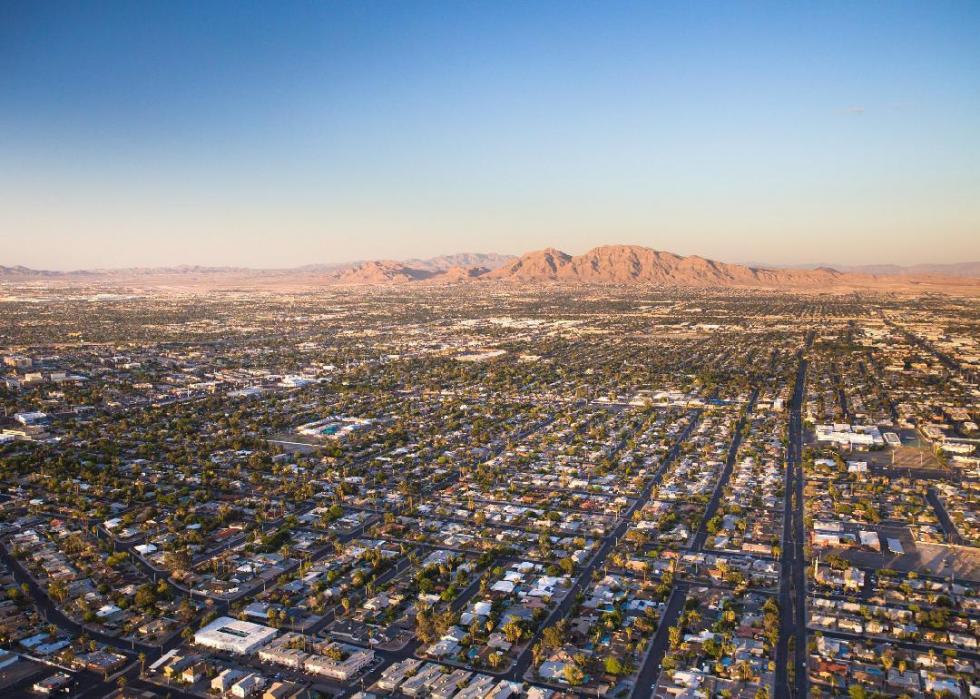
#42. Arizona
– Employed population: 2.9 million
– Members of unions: 155,000 (5.3% of employed population)
– Workers represented by unions: 207,000 (7.1% of employed population)
Arizona’s union history revolves around the mining industry, in a relationship that was often volatile and frequently violent, with race, immigration, and the inherent unpredictability of the metals industry fanning the flames. Unions have faced an uphill battle in the state since the first right-to-work laws were enacted in 1947.
11 / 51Robbymilo // Wikimedia Commons
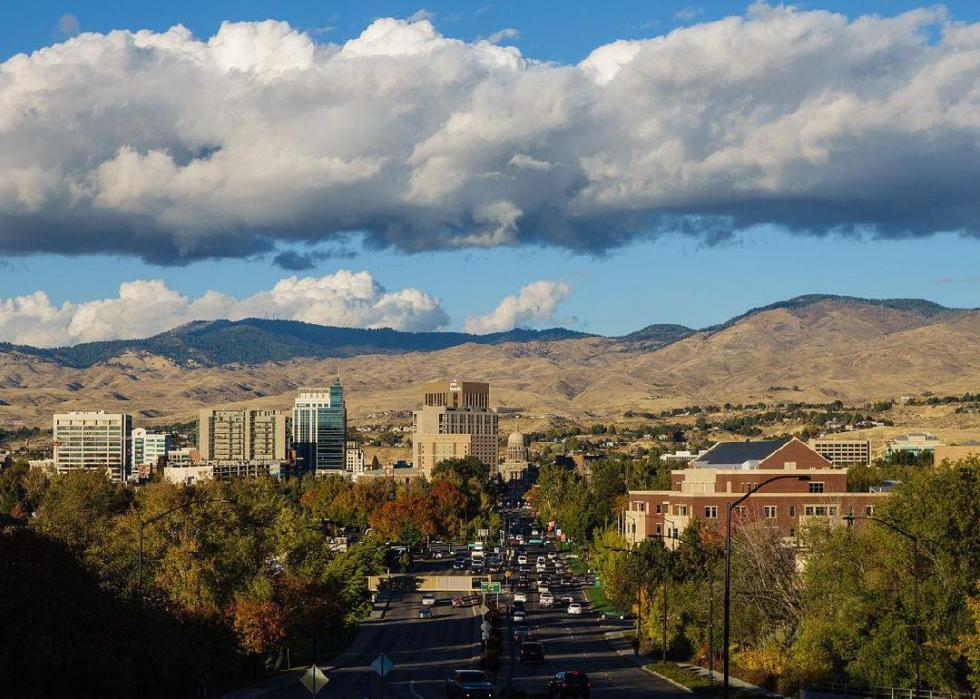
#41. Idaho
– Employed population: 732,000
– Members of unions: 41,000 (5.6% of employed population)
– Workers represented by unions: 47,000 (6.4% of employed population)
Idaho’s union history can be traced back to the first half of the 20th century, to conflicts between laborers and corporate bosses in the booming timber industry. Today, Idaho is one of the 10 least unionized states in the country and part of a confederation of right-to-work states that spreads across the conservative Mountain West.
12 / 51Sean Pavone // Shutterstock
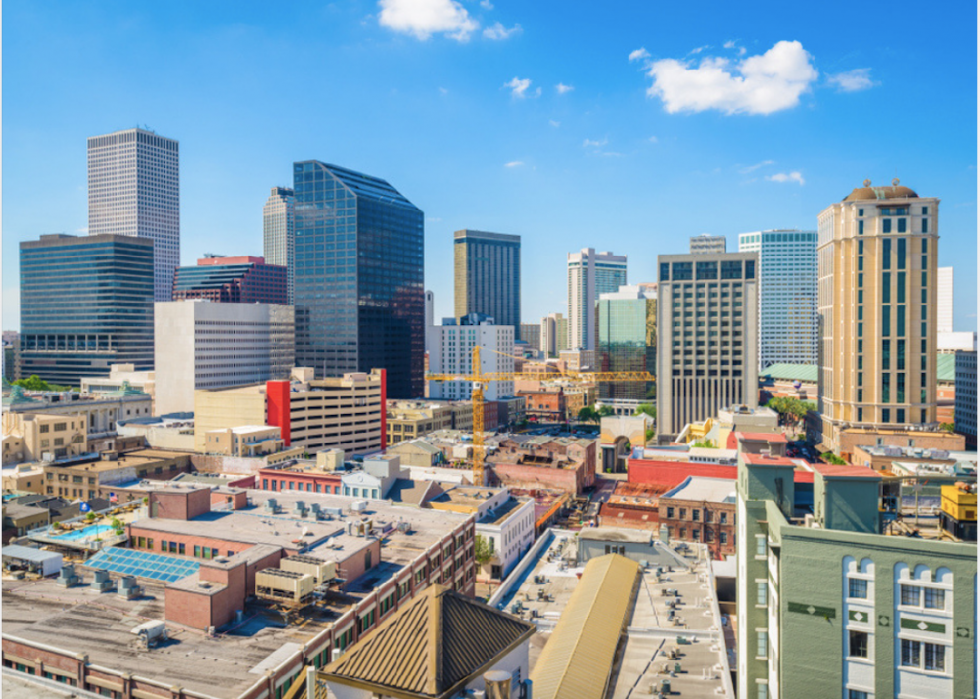
#40. Louisiana
– Employed population: 1.7 million
– Members of unions: 99,000 (5.9% of employed population)
– Workers represented by unions: 113,000 (6.7% of employed population)
In 1954, a scathing report by a man named William J. Dodd called the adoption of right-to-work laws in Louisiana “without question the most controversial legislative problem considered during the 1954 legislative session.” Although the law’s authors insisted their motives were based in liberating Louisiana workers, Dodd pointed out that the proposed law restricted the use of some of organized labor’s most important tools, like picketing or recruitment. The law was eventually adopted in 1976.
13 / 51Oklahoma CIty Convention and Visitor’s Bureau // Wikimedia Commons
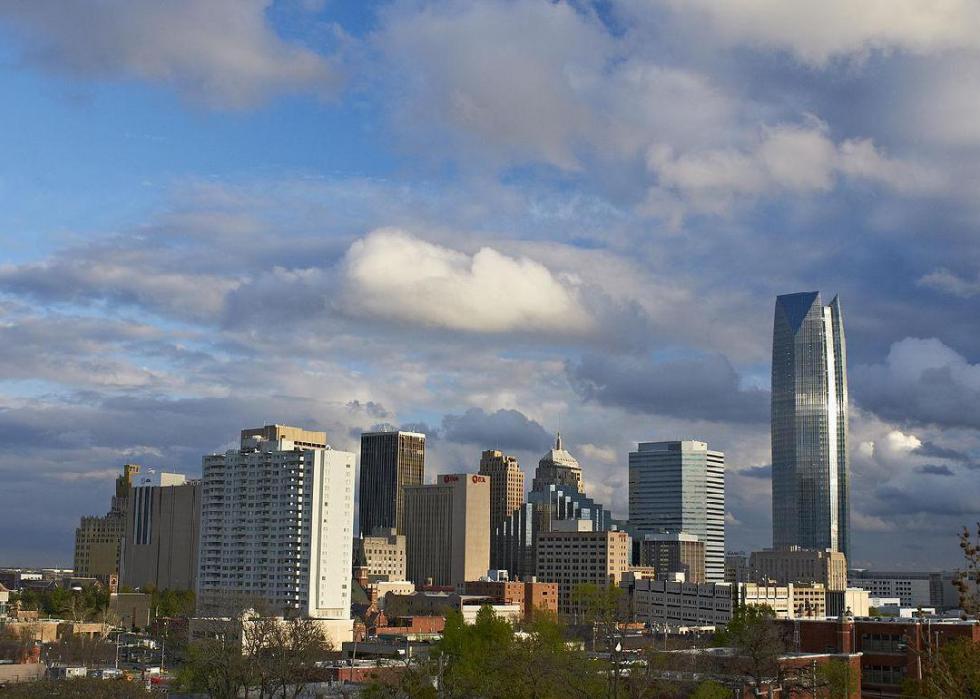
#39. Oklahoma
– Employed population: 1.5 million
– Members of unions: 90,000 (6.0% of employed population)
– Workers represented by unions: 114,000 (7.6% of employed population)
Union culture in Oklahoma began when the state was still a territory, through labor uprisings in the mining industry. The arrival of the railroad brought a new breed of union to Oklahoma, followed by the rise of agricultural unions in the state, and finally the appearance of trade unions.
14 / 51Guy RD // Shutterstock
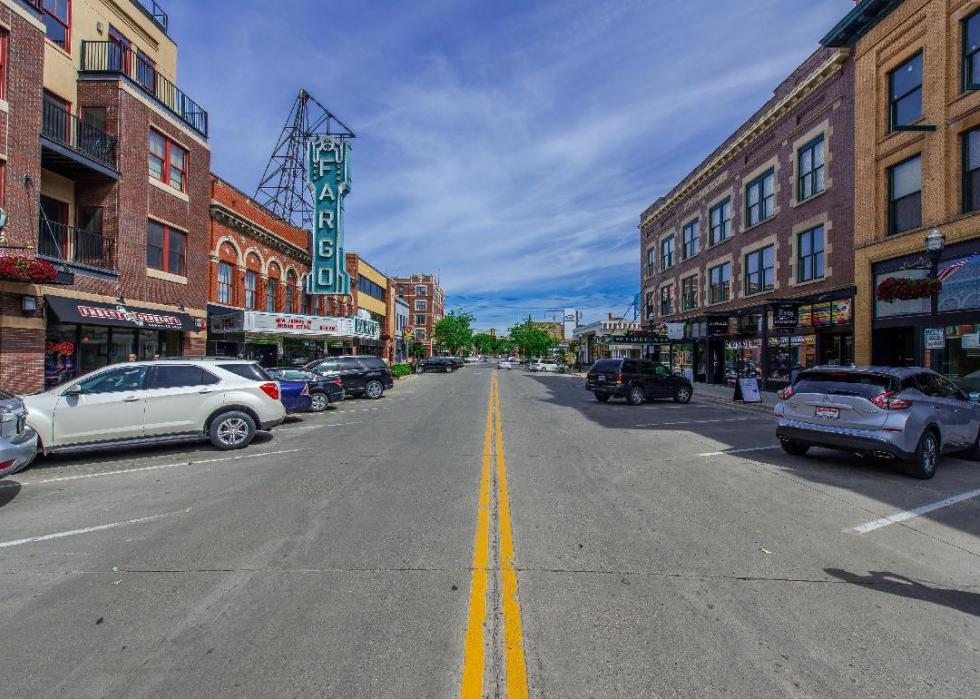
#38. North Dakota
– Employed population: 338,000
– Members of unions: 21,000 (6.2% of employed population)
– Workers represented by unions: 25,000 (7.4% of employed population)
The New Yorker recently investigated an interesting and still-evolving labor situation in North Dakota. Tensions were rising between Democratic Party opponents of the controversial Dakota Access pipeline and the labor unions that represented the workers. The infighting waned when the two groups seemed to find common ground, as large numbers of oil workers shifted to clean-energy jobs making wind turbines as oil industry employment stagnated.

15 / 51Jillian Cain Photography // Shutterstock
#37. Florida
– Employed population: 8.2 million
– Members of unions: 524,000 (6.4% of employed population)
– Workers represented by unions: 644,000 (7.9% of employed population)
When Florida was called for President Trump in the 2020 election, it became clear that Democrats would not get the election night knockout punch they had hoped for. Their allies in labor, however, won a major victory in the Sunshine State that day. More than 60% of voters passed a ballot measure that will raise the state minimum wage from $8.56 to $15 an hour by 2026, giving 2.5 million low-wage Florida workers a raise.
16 / 51Alan Light // Flickr
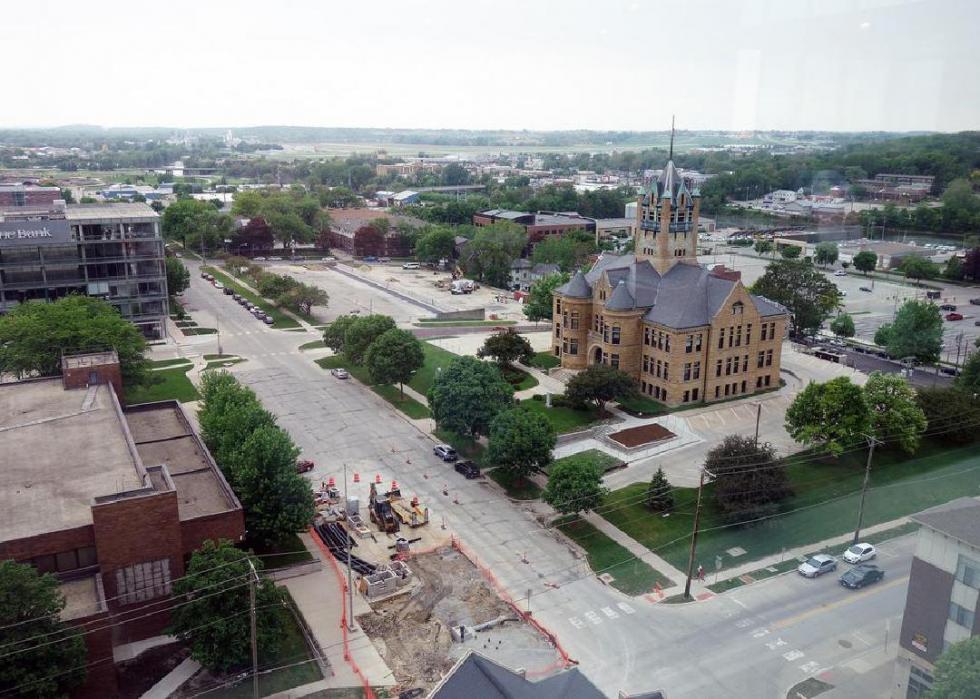
#36. Iowa
– Employed population: 1.4 million
– Members of unions: 93,000 (6.6% of employed population)
– Workers represented by unions: 128,000 (9.1% of employed population)
As the 2020 presidential election grabbed all the headlines, thousands of public employees in Iowa turned out to vote in union recertification elections that determine whether or not they’ll retain their collective bargaining power. In 2017, Iowa’s conservative leaders succeeded in creating the recertification requirements to weaken unions further in the right-to-work state, but Democratic lawmakers are fighting back.
17 / 51Asaavedra32 // Wikimedia Commons
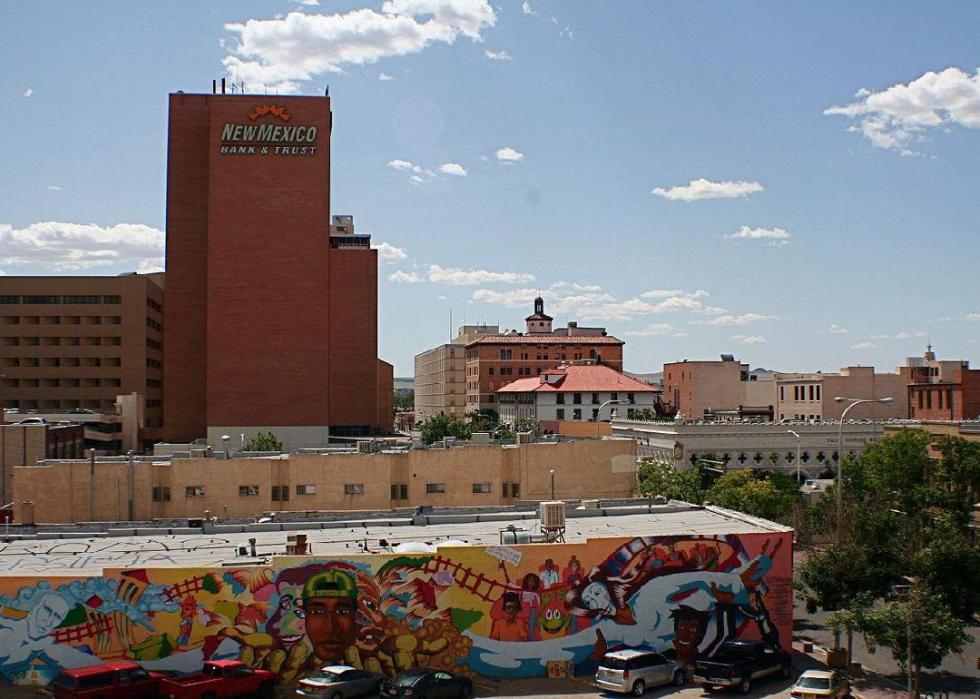
#35. New Mexico
– Employed population: 743,000
– Members of unions: 53,000 (7.1% of employed population)
– Workers represented by unions: 64,000 (8.6% of employed population)
New Mexico is the first state on this list that is not a right-to-work state—and it’s also the first where more than 7% of the employed population are union members. It was up over 8% as recently as 2017, but even that represents a decline from pre-recession membership.
18 / 51Ken L. // Wikimedia Commons
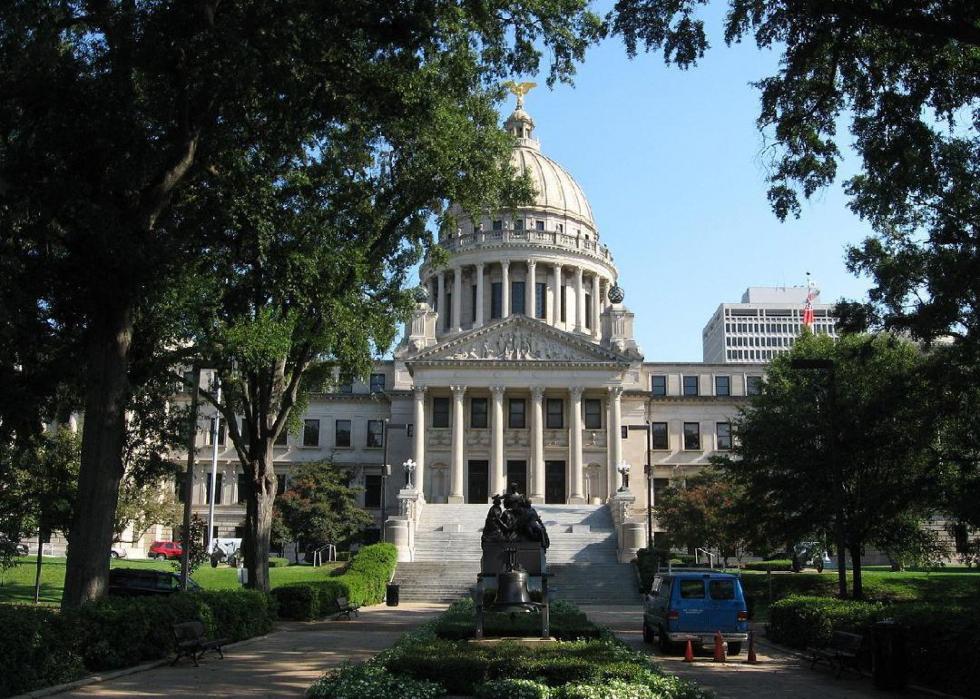
#34. Mississippi
– Employed population: 1.0 million
– Members of unions: 74,000 (7.1% of employed population)
– Workers represented by unions: 86,000 (8.3% of employed population)
In the tumultuous 1950s and ’60s, union membership plummeted in Mississippi and much of the South as labor leaders allied with civil rights organizations. Although Mississippi is back up over 7% in terms of union membership, the state is still dominated by pro-business conservatives, hostile toward the labor movement and suspicious of unions.
19 / 51Schlendiran // Wikimedia Commons
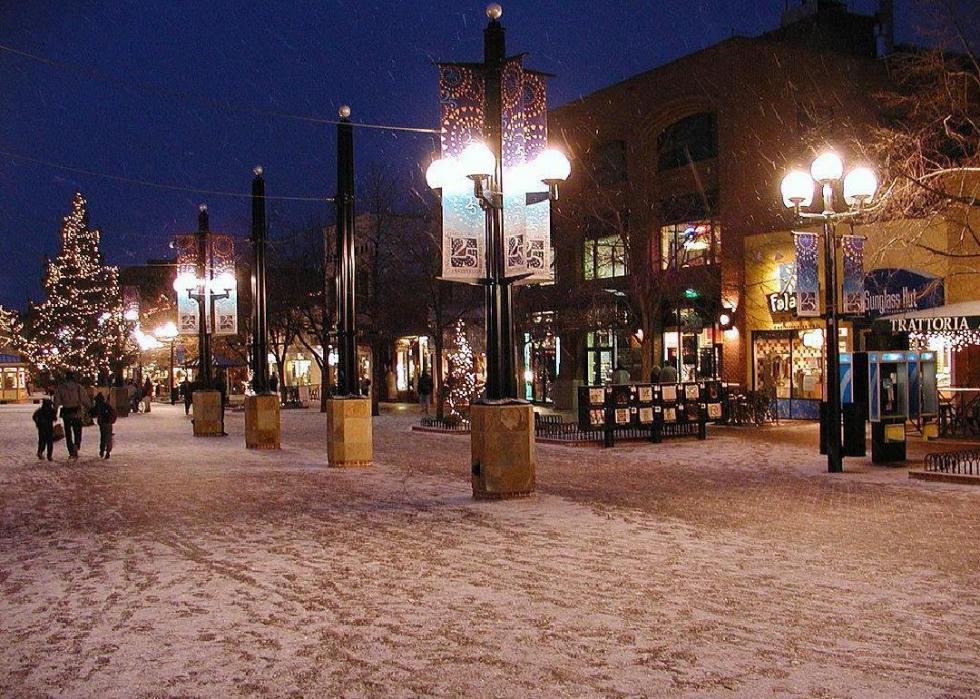
#33. Colorado
– Employed population: 2.5 million
– Members of unions: 182,000 (7.4% of employed population)
– Workers represented by unions: 202,000 (8.2% of employed population)
In 2018, something happened in Colorado that’s a rarity in the modern era—union membership increased from 9.6% to 11%. The success was shortlived, however, and the state is now all the way down to 7.4%, its lowest union membership level since 2015.

20 / 51Thomas Kelley // Shutterstock
#32. Kentucky
– Employed population: 1.7 million
– Members of unions: 127,000 (7.5% of employed population)
– Workers represented by unions: 160,000 (9.4% of employed population)
Few states have a labor history as dramatic, bloody, and consequential as the coal wars that consumed Kentucky throughout the late 1800s and early 20th century—particularly the Harlan County War of the 1930s. In recent years, Kentucky has never been able to compete with Ohio and West Virginia in terms of the percentage of its miners who were union members. Membership plummeted from an already low 35% of miners in 1997 to 17% in 2017.
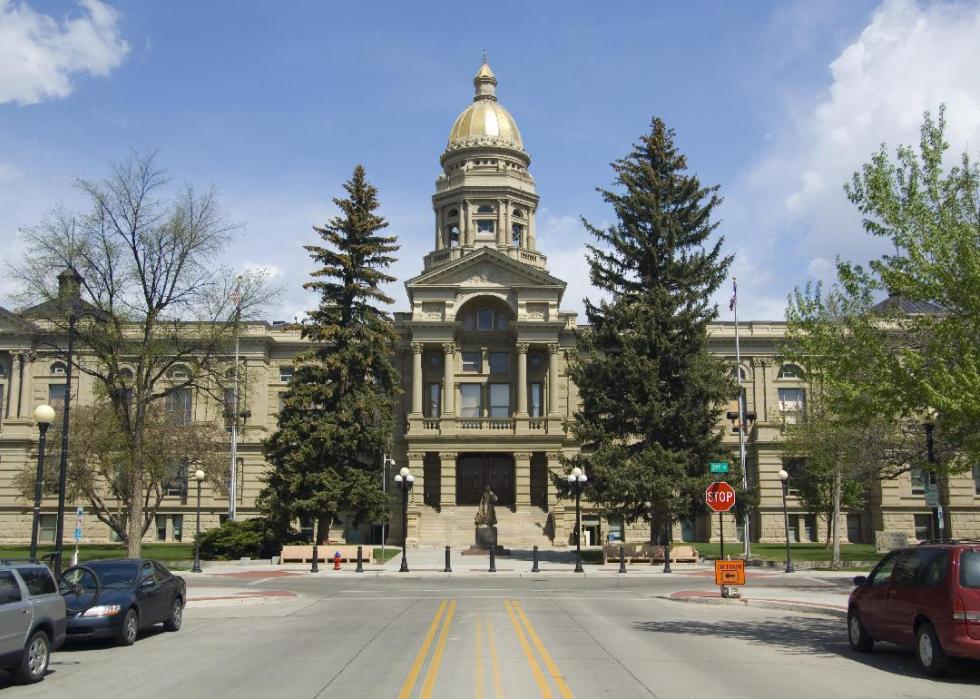
21 / 51J. Norman Reid // Shutterstock
#31. Wyoming
– Employed population: 240,000
– Members of unions: 18,000 (7.6% of employed population)
– Workers represented by unions: 22,000 (9.3% of employed population)
Wyoming serves as the bridge between two solid blocks of right-to-work states—one in the Midwest and the other in the Mountain West. To Wyoming’s east are solid-red North Dakota down through Texas and to the west are Idaho, Utah, Nevada, and Arizona.
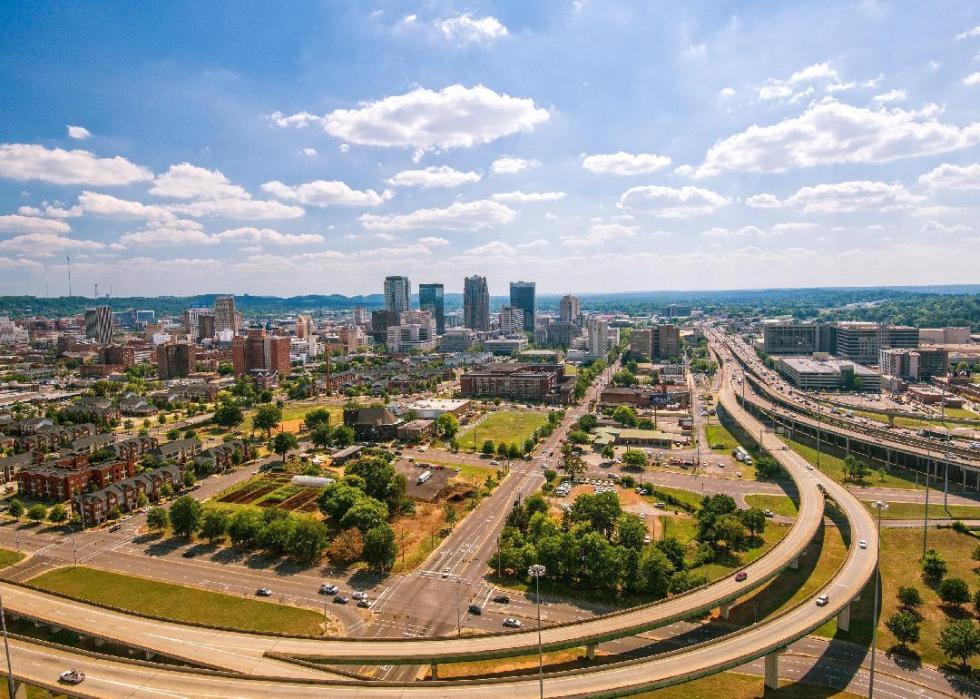
22 / 51BJ Ray // Shutterstock
#30. Alabama
– Employed population: 1.9 million
– Members of unions: 151,000 (8.0% of employed population)
– Workers represented by unions: 164,000 (8.7% of employed population)
About 8% of Alabama’s employed population are union members. Although that’s still below the national average, it’s significantly higher than its neighbors in the Deep South, the heart of America’s right-to-work culture.
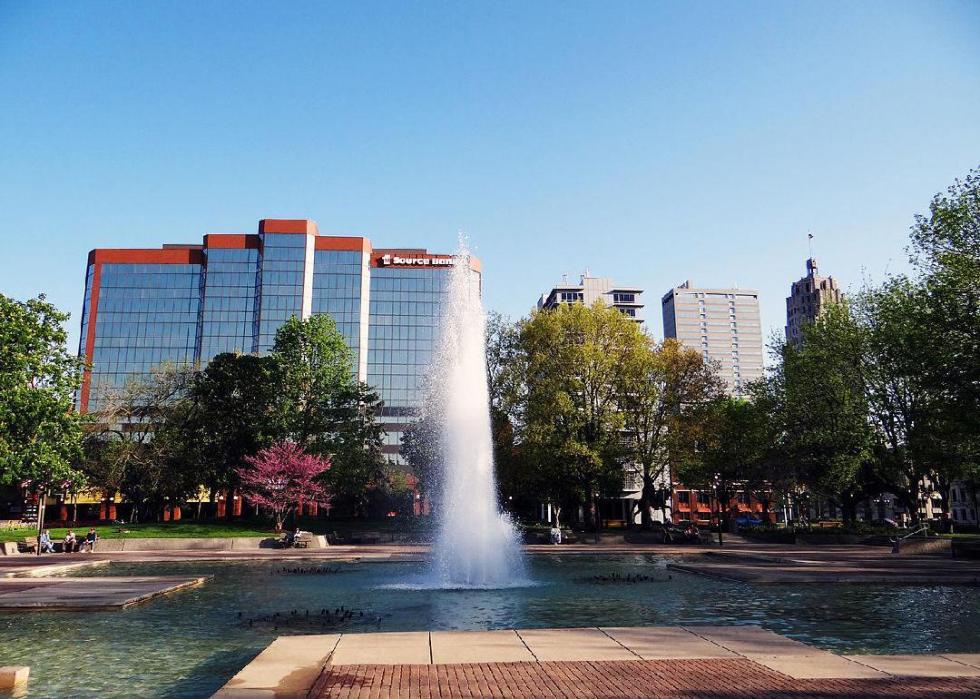
23 / 51Momoneymoproblemz // Wikimedia Commons
#29. Indiana
– Employed population: 2.8 million
– Members of unions: 235,000 (8.3% of employed population)
– Workers represented by unions: 270,000 (9.5% of employed population)
Union membership in Indiana reached 12.4% in 2011. The next year, the state enacted right-to-work legislation, and the decades-long decline in union membership quickly accelerated.
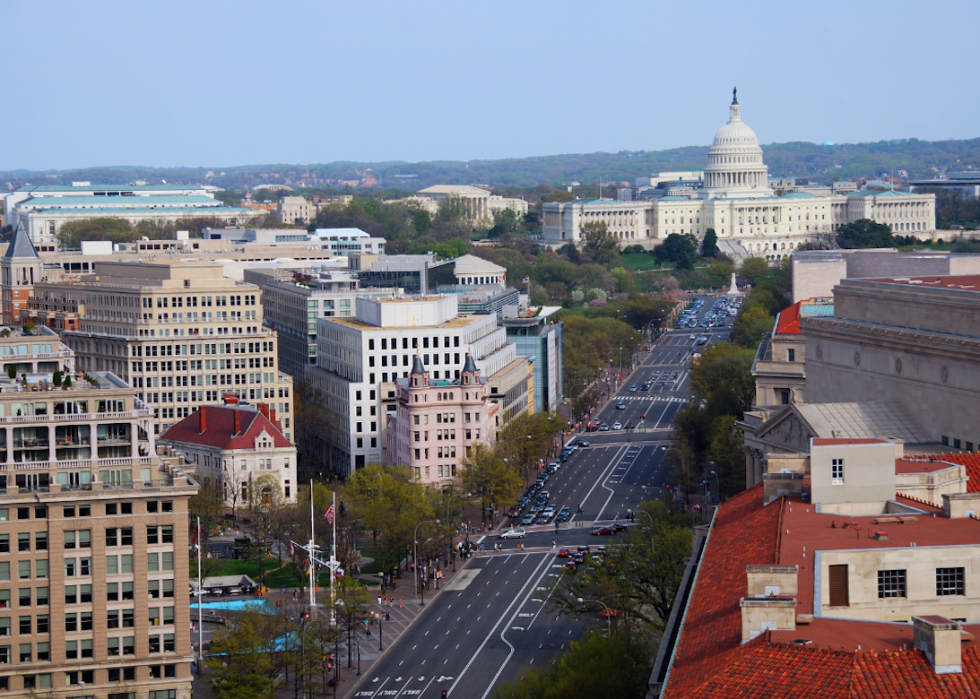
24 / 51Songquan Deng // Shutterstock
#28. Washington D.C.
– Employed population: 343,000
– Members of unions: 30,000 (8.6% of employed population)
– Workers represented by unions: 33,000 (9.5% of employed population)
The District of Columbia is situated right on the border of the pro-union Northeast and the South, where right-to-work laws first emerged and remain the strongest. Today, District government employees alone are represented by 114 collective bargaining units, 48 locals, and 15 international unions.
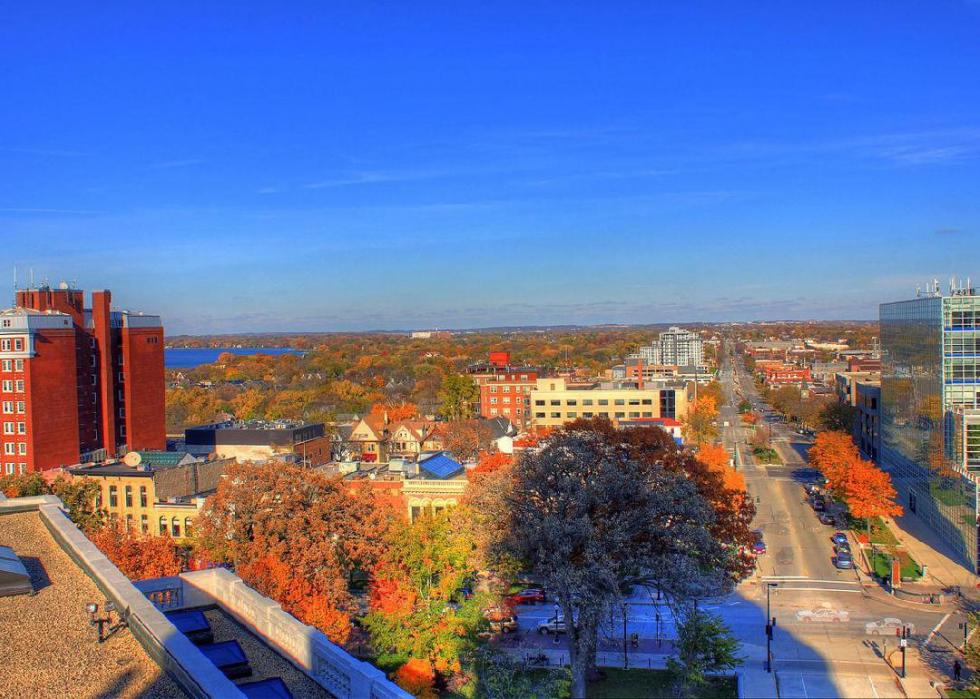
25 / 51Public Domain
#27. Wisconsin
– Employed population: 2.6 million
– Members of unions: 227,000 (8.7% of employed population)
– Workers represented by unions: 264,000 (10.2% of employed population)
Despite its long history as a labor stronghold for American agriculture and industry, Wisconsin is now a right-to-work state with membership numbers that lag well below the national average. The state’s membership percentages have also declined much more rapidly than they have in the country as a whole. In 1983, nationwide union membership had dropped to 18%, but nearly one in four Wisconsinites were still represented by organized labor. Today only 8.7% are union members.

26 / 51Sean Pavone // Shutterstock
#26. Kansas
– Employed population: 1.3 million
– Members of unions: 114,000 (8.9% of employed population)
– Workers represented by unions: 144,000 (11.2% of employed population)
In 2018, while Missouri was overwhelmingly rejecting a right-to-work measure, neighboring Kansas marked its 60-year anniversary as a right-to-work state. According to the Lawrence Journal-World, early labor opponents in Kansas were successful in exploiting fears of communism and integration to fracture a long-standing alliance between farmers and industry workers.
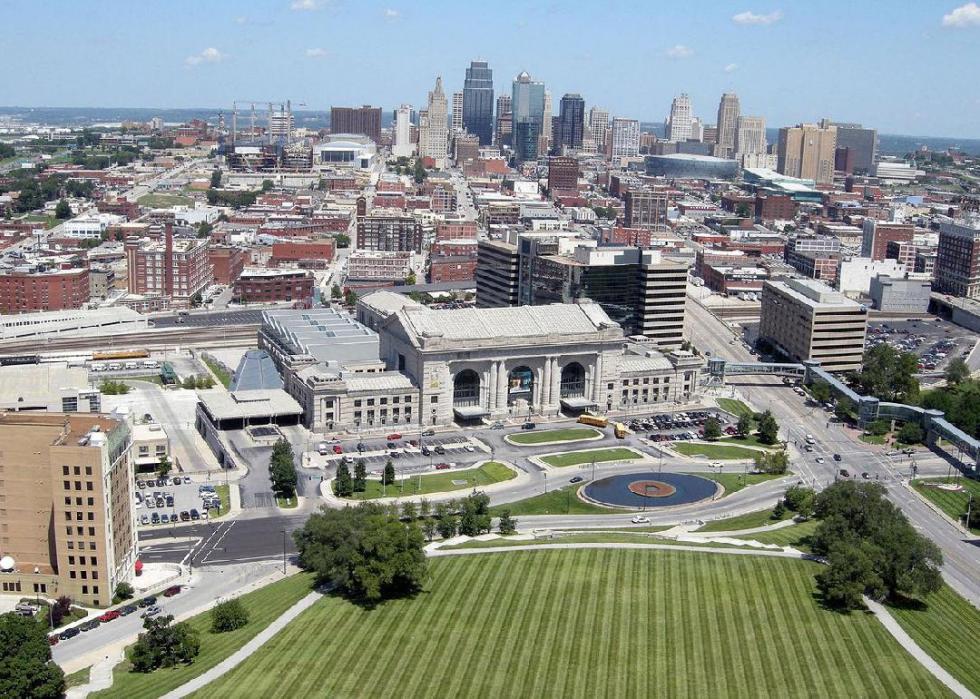
27 / 51Brian Hillegas // Wikimedia Commons
#25. Missouri
– Employed population: 2.5 million
– Members of unions: 238,000 (9.4% of employed population)
– Workers represented by unions: 254,000 (10.1% of employed population)
Missouri and neighboring Illinois are an island in a sea of right-to-work states, and Missouri voters chose to keep it that way when the issue came to a vote in 2018. A proposed right-to-work law was rejected by 67% of Missourians—an overwhelming majority.
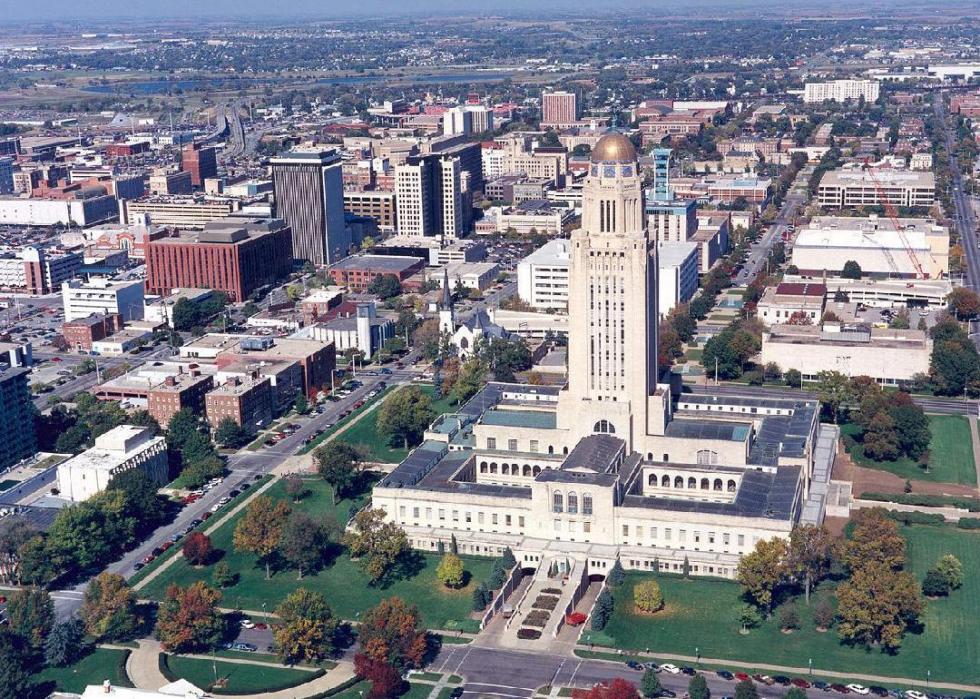
28 / 51Public Domain
#24. Nebraska
– Employed population: 890,000
– Members of unions: 85,000 (9.6% of employed population)
– Workers represented by unions: 94,000 (10.5% of employed population)
At the turn of the 20th century, bakers in Omaha went on strike to protest $10 weekly wages for 10-17 hour workdays in sweltering hot, subterranean oven facilities that were commonly worked by children. However, anti-union legislation enacted in the 1940s established Nebraska as one of the oldest right-to-work states in America and part of the anti-union stronghold in middle America that runs from the Dakotas down through Texas.
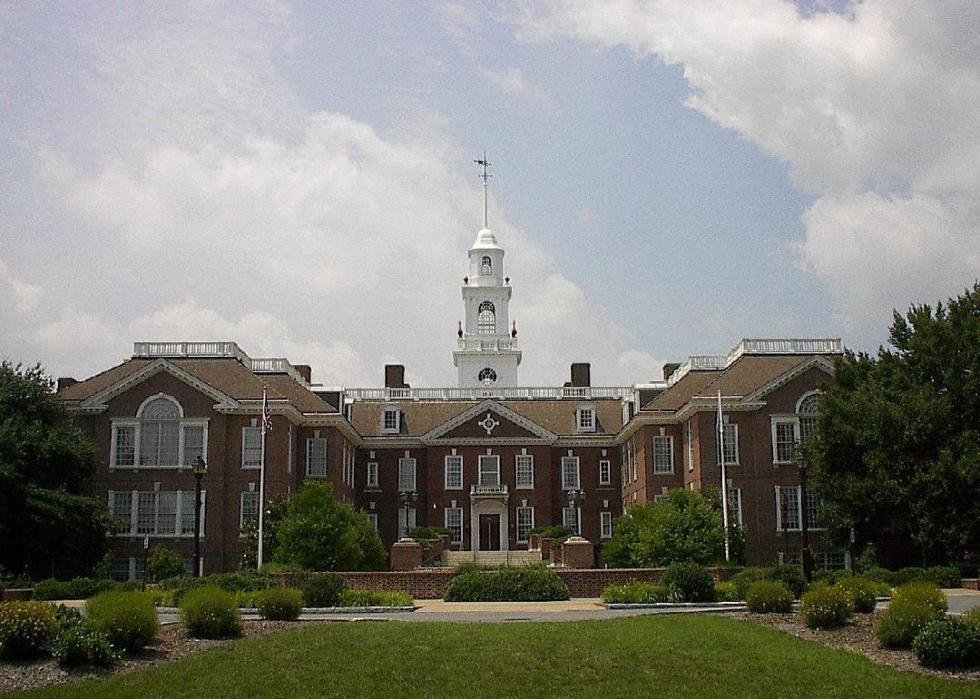
29 / 51Public Domain
#23. Delaware
– Employed population: 424,000
– Members of unions: 41,000 (9.7% of employed population)
– Workers represented by unions: 44,000 (10.3% of employed population)
Despite being halfway through the list, Delaware is only the fourth state so far that doesn’t enforce right-to-work laws, a fact that reinforces just how detrimental those kinds of laws are to organized labor. At the start of 2020, Delaware made headlines when its employees in the state legislature announced plans to unionize.
30 / 51AlexiusHoratius // Wikimedia Commons
#22. New Hampshire
– Employed population: 629,000
– Members of unions: 62,000 (9.8% of employed population)
– Workers represented by unions: 70,000 (11.1% of employed population)
Despite trending Republican from the late 1940s through the late 1980s, New Hampshire is now a reliably Democratic state. Labor unions there are small but influential. In 2017, organized labor in New Hampshire led a successful effort to defeat proposed right-to-work legislation in the state.
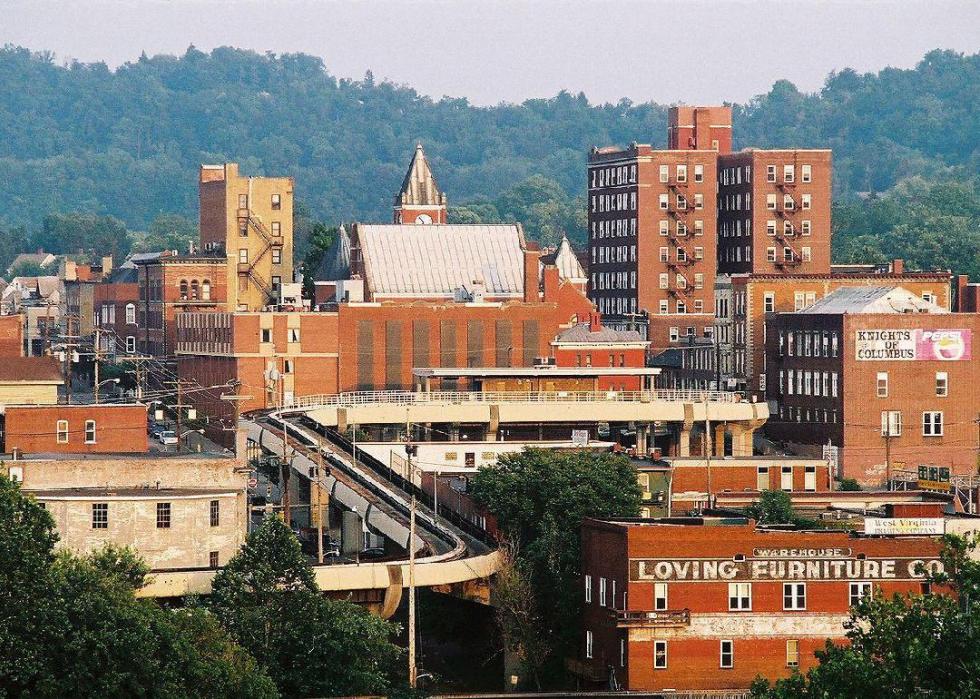
31 / 51Darren Ringer // Wikimedia Commons
#21. West Virginia
– Employed population: 666,000
– Members of unions: 71,000 (10.7% of employed population)
– Workers represented by unions: 75,000 (11.3% of employed population)
The first state with double-digit union membership percentages among its employed population is West Virginia, whose labor history is rich in drama. Like Kentucky, West Virginia was a primary battleground for the coal wars, where mining bosses and their collaborators in law enforcement and government terrorized, arrested, evicted, harassed, and murdered labor leaders and union members. In 1921, as many as 100 people died in the Blair Mountain Massacre, the largest labor uprising in American history, when strikebreakers and their allies in the military and police attacked thousands of West Virginia miners and their families.
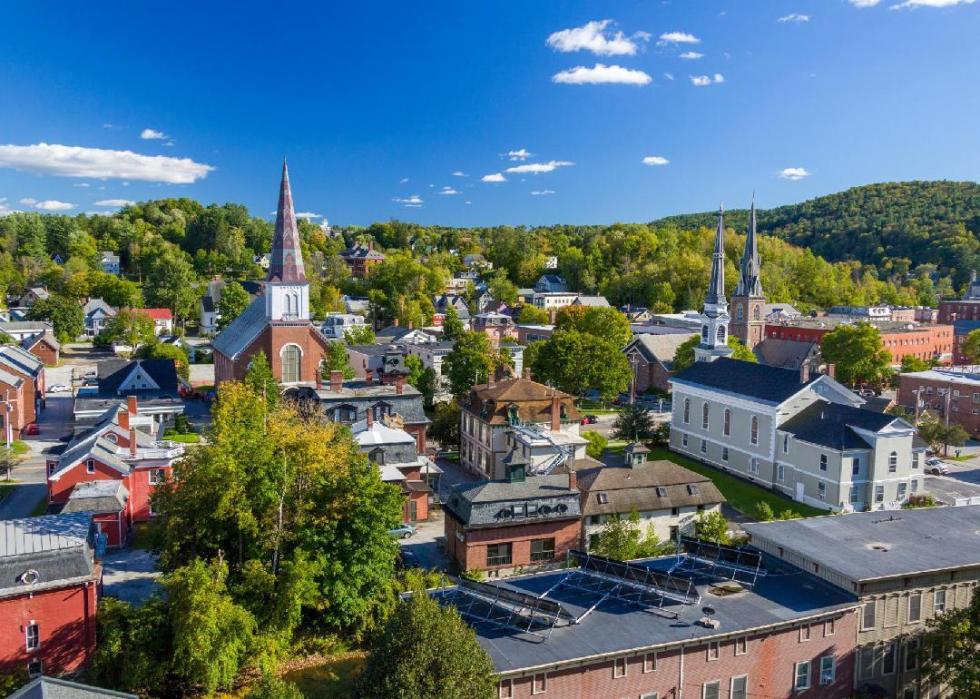
32 / 51Public Domain
#20. Vermont
– Employed population: 265,000
– Members of unions: 31,000 (11.8% of employed population)
– Workers represented by unions: 36,000 (13.8% of employed population)
Like all of its New England neighbors and the Northeast in general, Vermont is not a right-to-work state. In October 2020, the state’s Republican governor signed a bill that expands access to new employees for public-sector unions and includes other protections for organized labor.
33 / 51Paul Brady Photography // Shutterstock
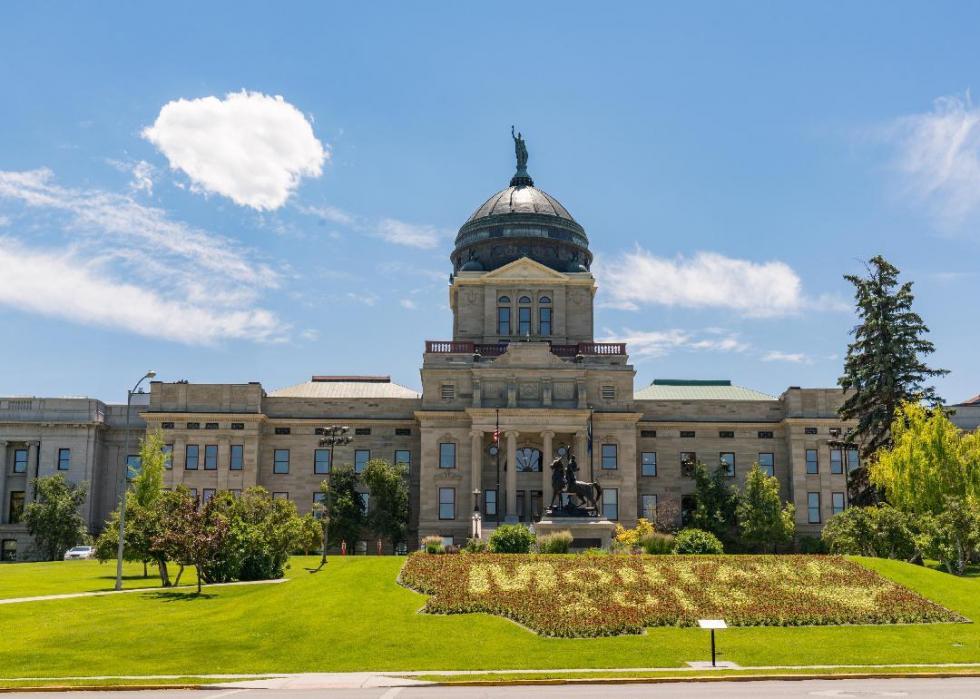
#19. Montana
– Employed population: 419,000
– Members of unions: 50,000 (12.0% of employed population)
– Workers represented by unions: 54,000 (13.0% of employed population)
Off the coast, the entire inland Western United States from Missouri to the Pacific Ocean is made up of right-to-work states except three: blue Colorado and New Mexico, which fit the pattern, and ruby red Montana. A right-to-work bill, supported by the state’s Republican governor, was defeated on the floor of the Montana House of Representatives in March 2021.
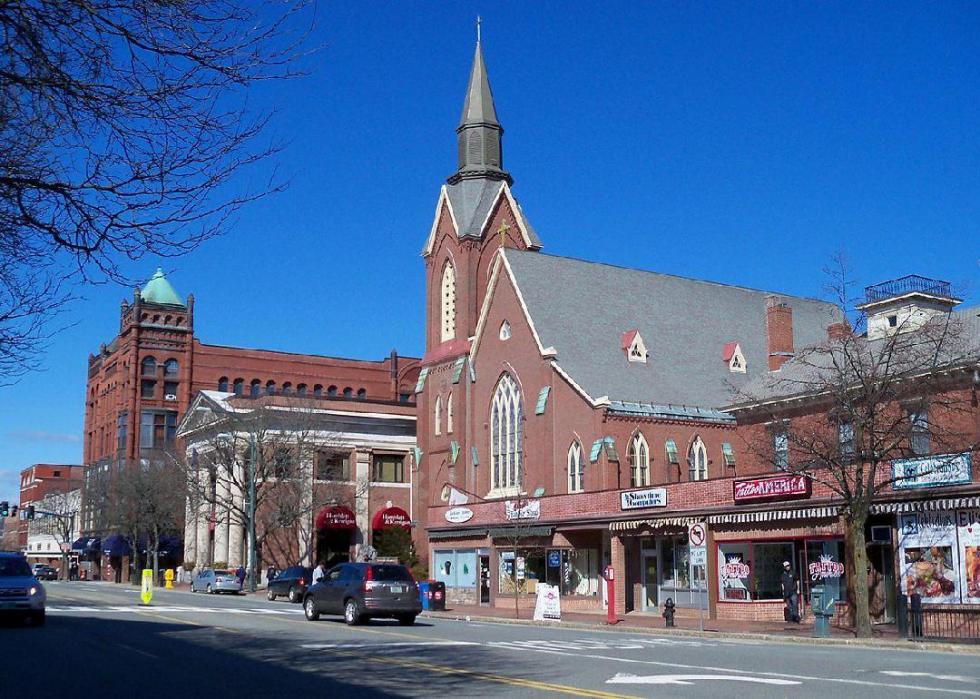
34 / 51GoodFreePhotos
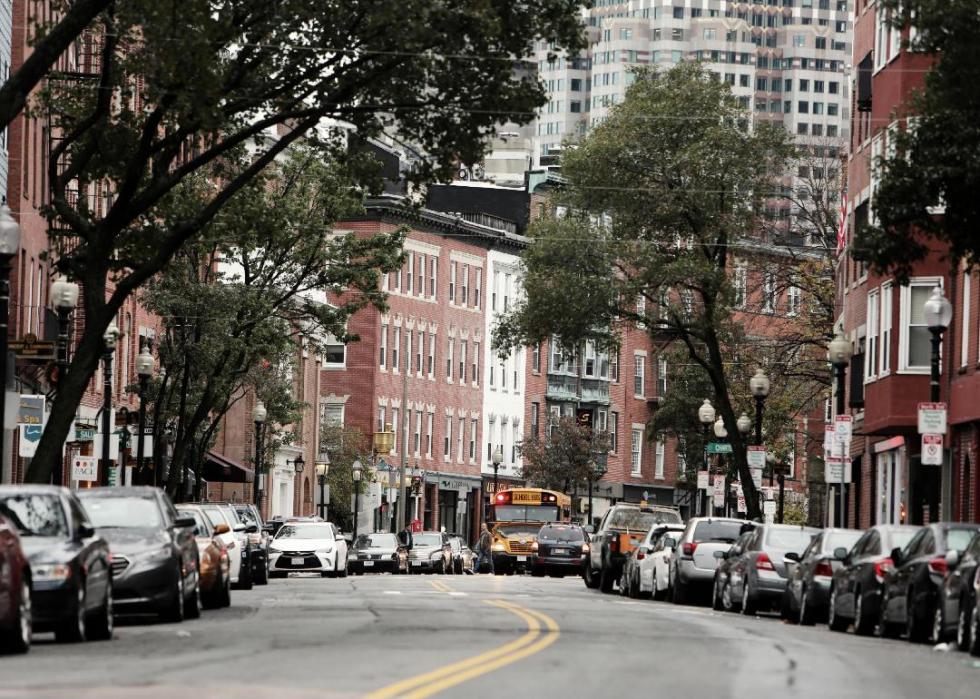
#18. Massachusetts
– Employed population: 3.0 million
– Members of unions: 357,000 (12.0% of employed population)
– Workers represented by unions: 383,000 (12.8% of employed population)
Labor in Massachusetts recently flexed its muscles when the governor began devising reopening plans in May 2020, after the pandemic forced an economic shutdown in the state. Since union laborers comprised the majority of the front-line service workers who would be most affected, union leaders demanded a seat at the table of the committee tasked with crafting the reopening strategy.
35 / 51Mbell1975 // Wikimedia Commons
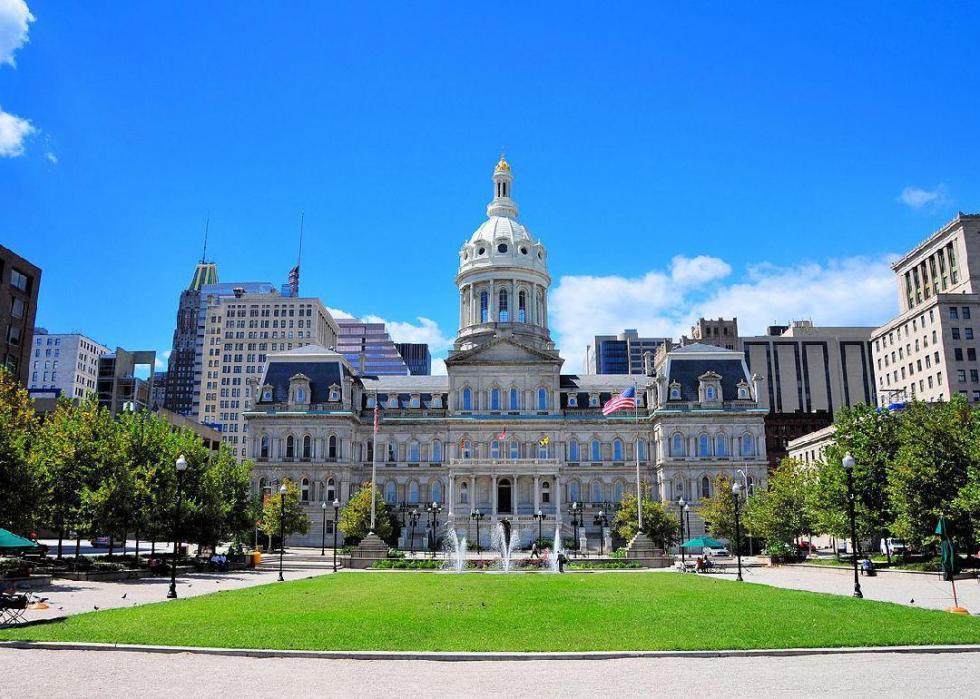
#17. Maryland
– Employed population: 2.7 million
– Members of unions: 351,000 (13.1% of employed population)
– Workers represented by unions: 380,000 (14.1% of employed population)
In Maryland, the top two Food and Commercial Workers local unions represent the largest number of union members in the state by far. Together, locals 400 and 27 boast more than 43,000 members.
36 / 51Public Domain
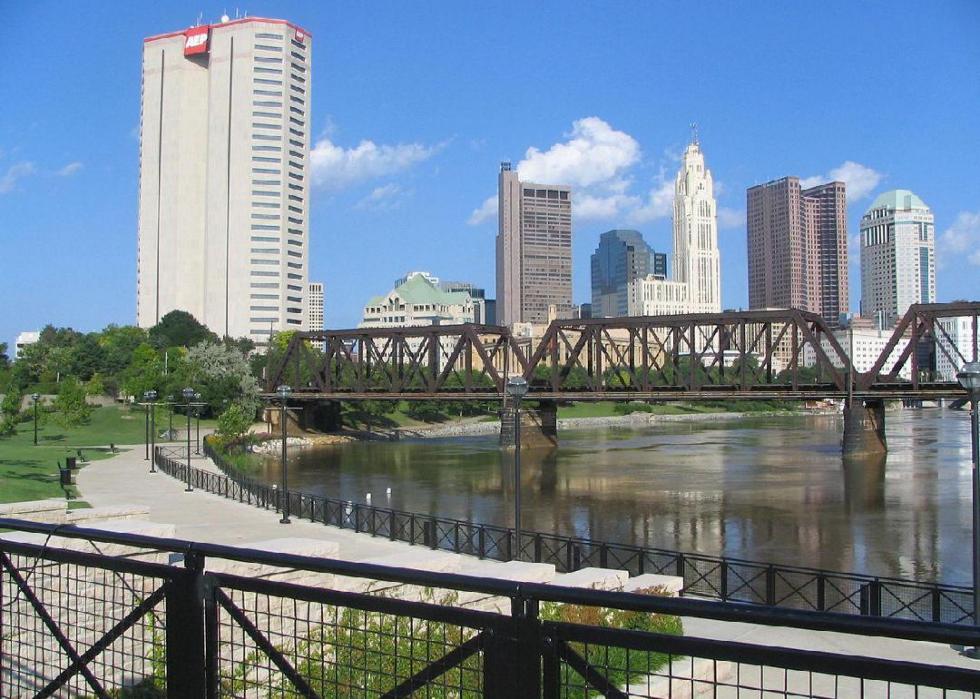
#16. Ohio
– Employed population: 4.8 million
– Members of unions: 637,000 (13.2% of employed population)
– Workers represented by unions: 686,000 (14.2% of employed population)
A strange and headline-generating reversal of alliances played out in a battle between a Republican incumbent and Democratic challenger in a recent 2018 Ohio House election: virtually all significant unions in both the public and private sectors endorsed the GOP incumbent. Nationally, 90% of union spending goes to Democrats, but in Ohio in 2019 it was almost evenly split.
37 / 51littlenySTOCK // Shutterstock
#15. Nevada
– Employed population: 1.2 million
– Members of unions: 161,000 (13.4% of employed population)
– Workers represented by unions: 186,000 (15.4% of employed population)
The sheer size of the Las Vegas hospitality industry makes Nevada hard to compare to other states, but it has proven to be a model for union strength in modern times. However, its 161,000 union members represent a decline of 19% over last year alone.
38 / 51Derek.cashman // Wikimedia Commons
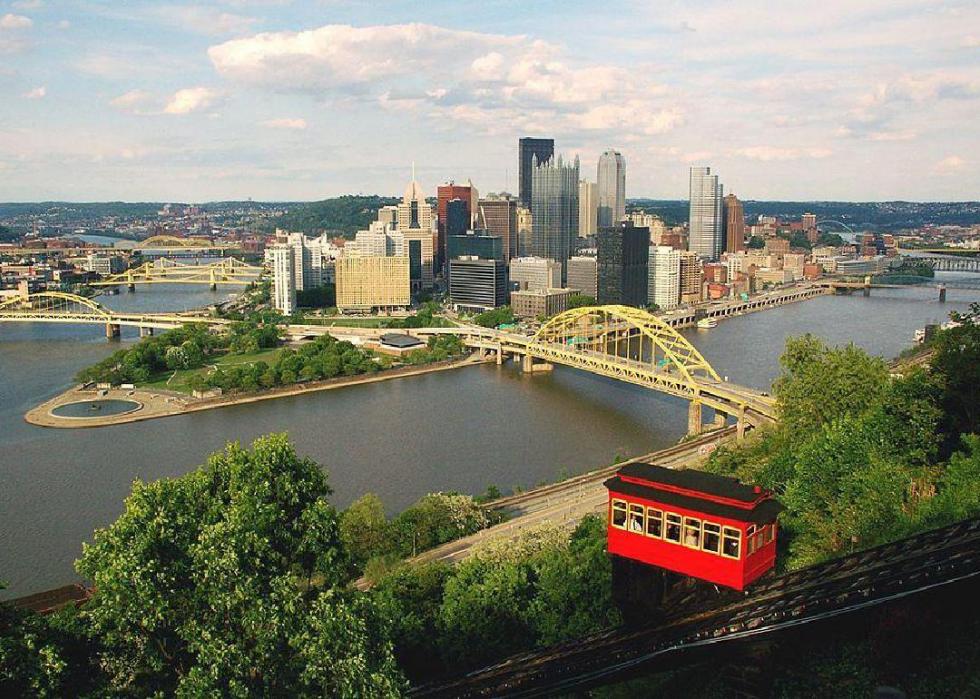
#14. Pennsylvania
– Employed population: 5.3 million
– Members of unions: 717,000 (13.5% of employed population)
– Workers represented by unions: 775,000 (14.6% of employed population)
As an early leader in the mining, railroad, coal, and agriculture industries, Pennsylvania played a critical role in America’s formative organized labor movements. It’s not a right-to-work state, and starting in 1988, non-union, public-sector laborers who didn’t want to join or pay dues paid a reduced fee to be covered by union-earned collective bargaining agreements. Called the fair-share fee, this plan—and others like it all across America—were struck down by the Supreme Court in 2018 in a devastating decision against organized labor.
39 / 51Daniel Schwen // Wikimedia Commons
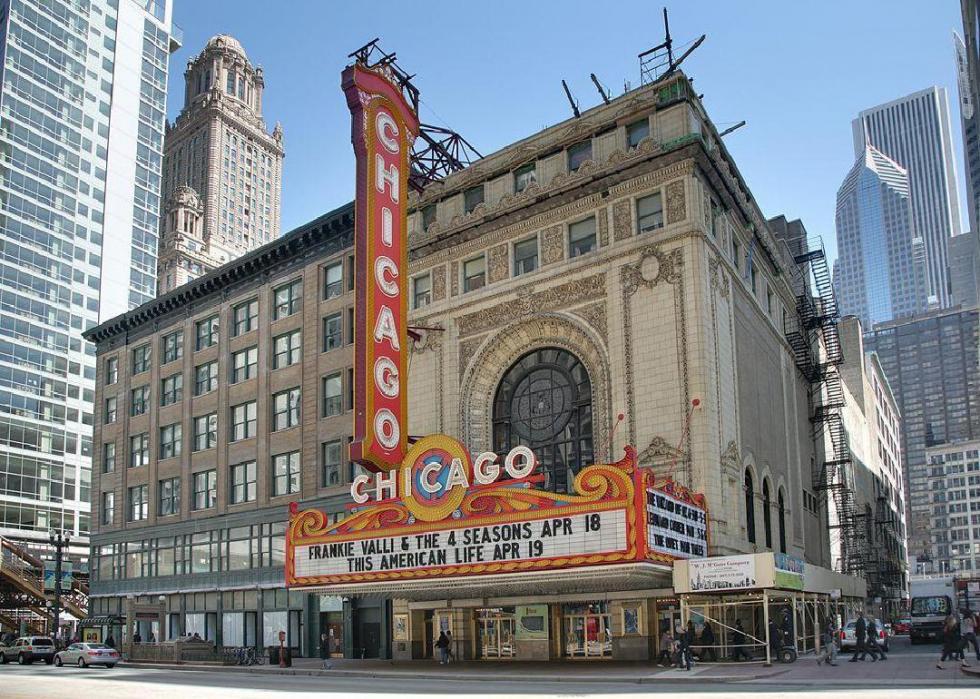
#13. Illinois
– Employed population: 5.2 million
– Members of unions: 739,000 (14.3% of employed population)
– Workers represented by unions: 788,000 (15.2% of employed population)
The Pullman Strike, which led to the creation of Labor Day, took place in Illinois, home to the final resting place of Mother Jones. Some of the most important moments in the history of organized labor took place in Illinois as well, including the Cherry Mine Disaster, the Herrin Massacre, and the Haymarket Affair.
40 / 51Christopher Boswell // Shutterstock
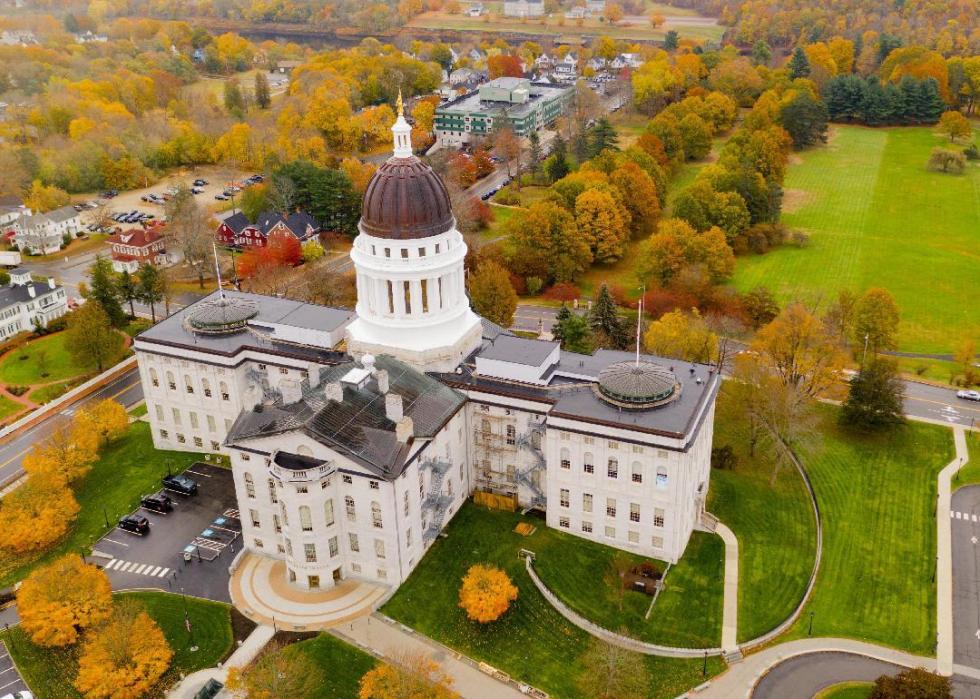
#12. Maine
– Employed population: 559,000
– Members of unions: 82,000 (14.7% of employed population)
– Workers represented by unions: 93,000 (16.7% of employed population)
In 2017, Republican Gov. Paul LePage pushed to have Maine become the first Northeastern state to pass a right-to-work law. LePage argued that it was a necessary step to attract businesses, but his push was unsuccessful, the mixed state legislature balked, and in 2019, Maine elected a Democratic governor.
41 / 51Rachel KRamer // Wikimedia Commons
#11. Michigan
– Employed population: 4.0 million
– Members of unions: 604,000 (15.2% of employed population)
– Workers represented by unions: 661,000 (16.6% of employed population)
In 2012, Michigan shocked the country when it became the 24th state to pass a right-to-work law in what had long been the cultural, historical, and political heart of the American labor movement. In 2018, five years after the law went into effect, nine of Michigan’s 11 largest unions reported declines in membership and political spending.
42 / 51photo.ua // Shutterstock
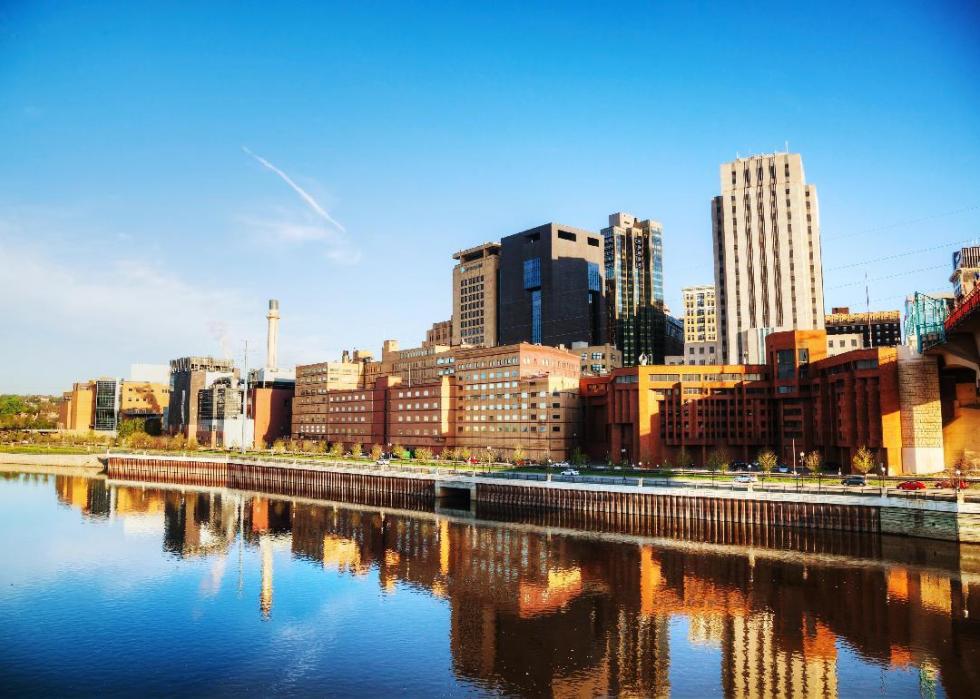
#10. Minnesota
– Employed population: 2.5 million
– Members of unions: 398,000 (15.8% of employed population)
– Workers represented by unions: 427,000 (17.0% of employed population)
Minnesota joins Ohio, Illinois, and Missouri as the only remaining states in the Midwest not governed by right-to-work laws. The state’s labor activists are famous for their intense political participation, and Minnesota union membership has increased as the state adds more and more jobs.
43 / 51Public Domain
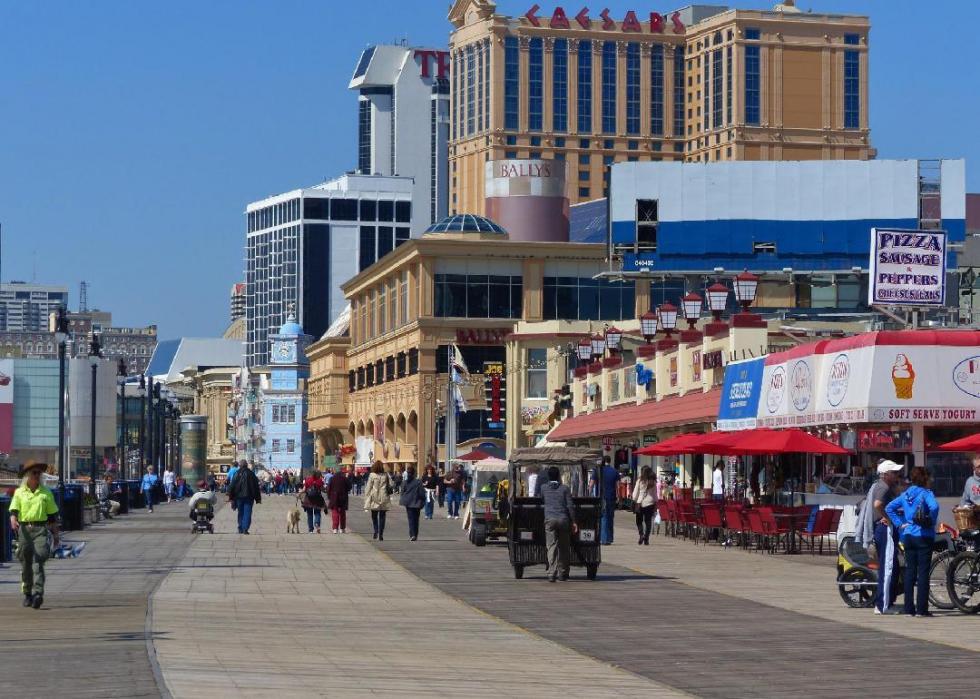
#9. New Jersey
– Employed population: 3.7 million
– Members of unions: 600,000 (16.1% of employed population)
– Workers represented by unions: 660,000 (17.8% of employed population)
New Jersey is home to some of the oldest industrial centers, and its history in the labor movement goes back nearly as far as the industrial revolution. Shortly after the country won its independence, laborers in New Jersey’s massive shoemaking industry organized for better working conditions.
44 / 51Canva
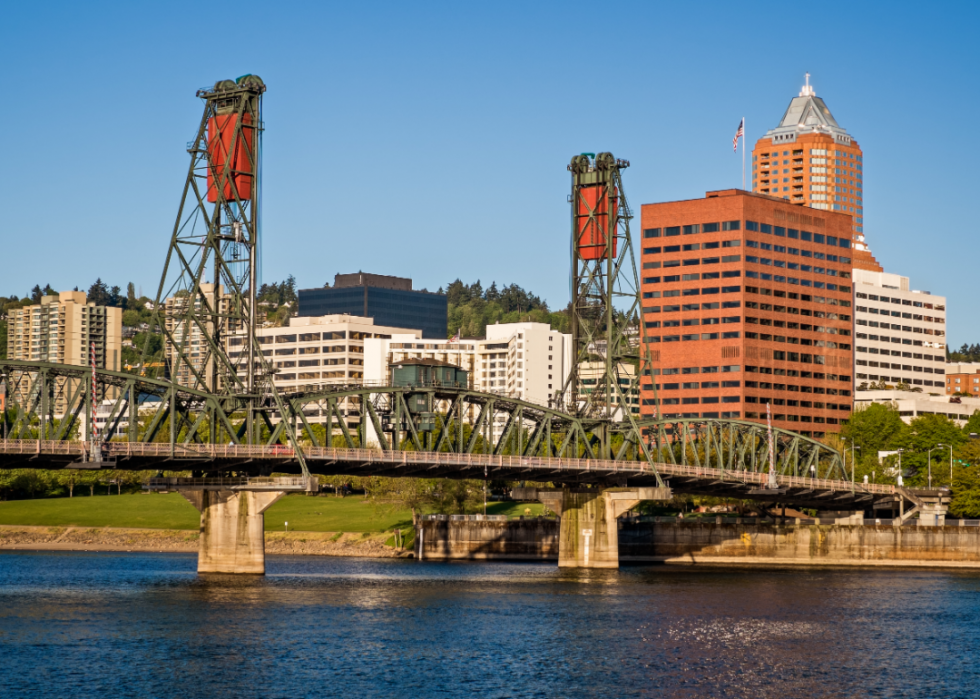
#8. Oregon
– Employed population: 1.7 million
– Members of unions: 275,000 (16.2% of employed population)
– Workers represented by unions: 293,000 (17.3% of employed population)
Oregon is part of the organized labor stronghold that is the American West Coast. As union membership declined nationwide in 2019, membership rolls in Oregon went up. The downside, however, is that the influence of organized labor appears to have waned since the Supreme Court ruled in 2018 that non-union members can’t be forced to financially contribute to collective bargaining initiatives.
45 / 51Canva
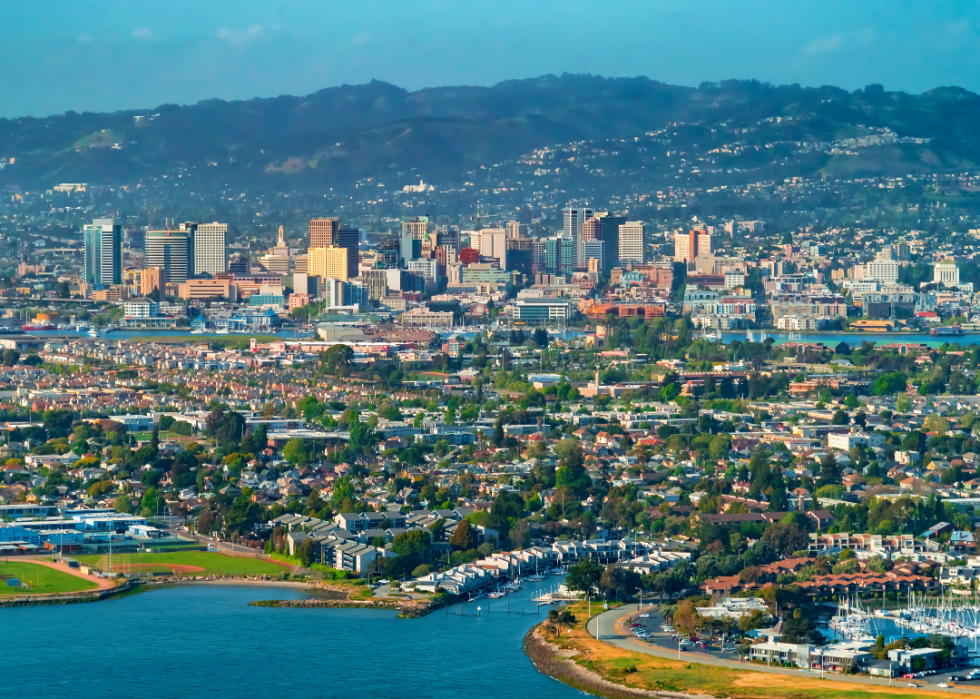
#7. California
– Employed population: 15.1 million
– Members of unions: 2.4 million (16.2% of employed population)
– Workers represented by unions: 2.7 million (17.6% of employed population)
California is one of only two states in America that still measures its union members in the millions—and organized labor’s membership rolls in the Golden State continue to grow. After years of decline, unions in California realized gains among electricians, nurses, mechanics, researchers, animation artists, and more. This growth has been enabled by a labor-friendly state legislature.
46 / 51Sean Pavone // Shutterstock
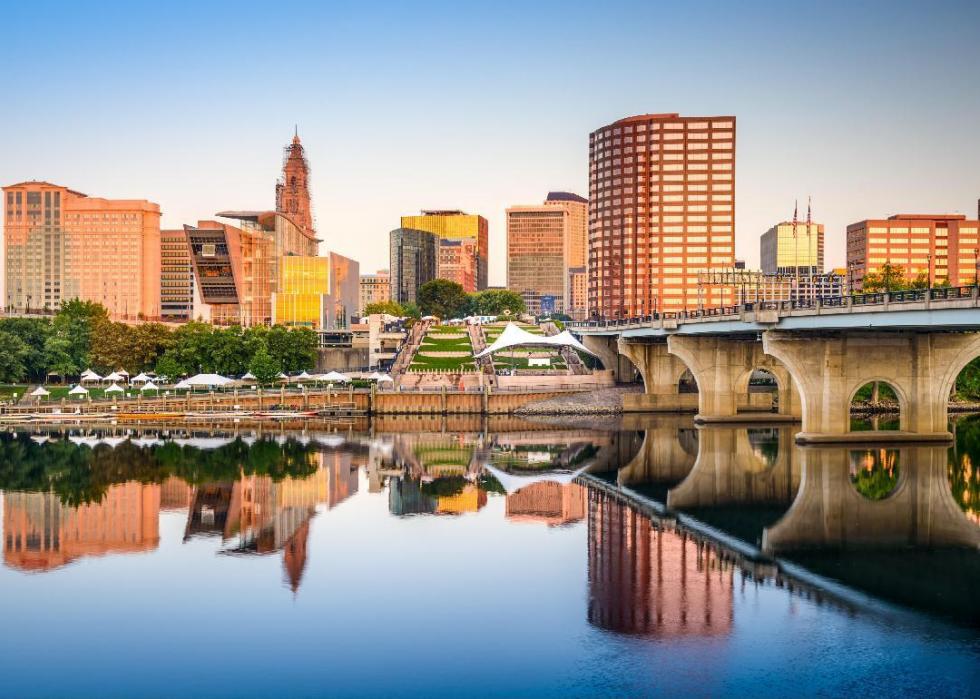
#6. Connecticut
– Employed population: 1.5 million
– Members of unions: 262,000 (17.1% of employed population)
– Workers represented by unions: 282,000 (18.4% of employed population)
Connecticut has recently been a battleground for the labor movement in the Northeast. In 2019, unions prevailed in two high-profile legislative battles, one that guaranteed a $15 minimum wage and another that granted paid medical leave. With other hotly contested measures currently up for discussion, Connecticut remains on the front lines of the region’s upcoming labor battles.
47 / 51Oragne_Suede_Sofa // Wikimedia Commons
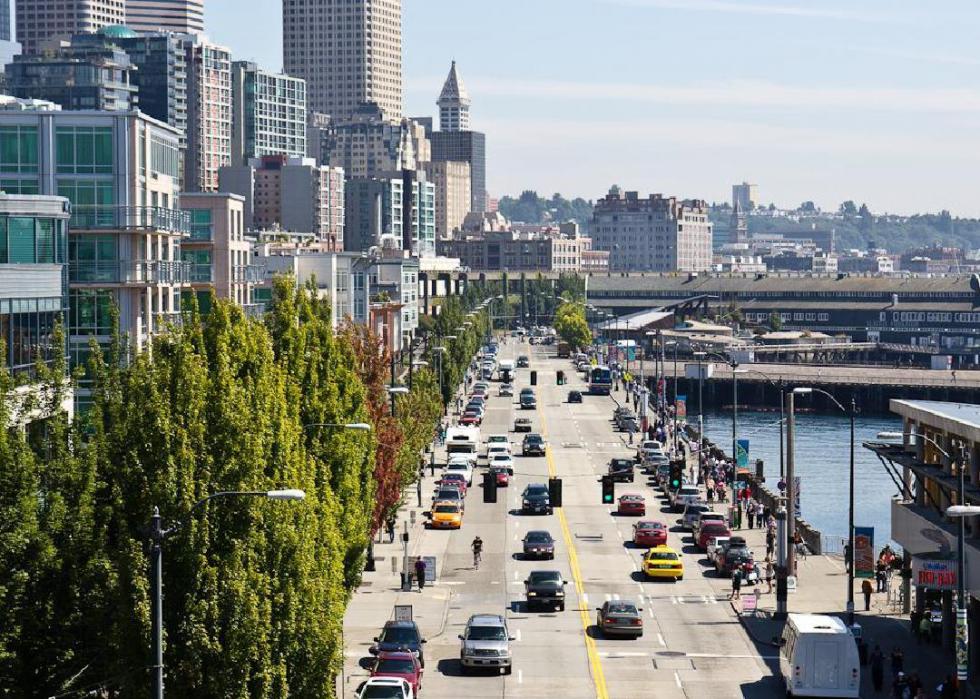
#5. Washington
– Employed population: 3.2 million
– Members of unions: 557,000 (17.4% of employed population)
– Workers represented by unions: 596,000 (18.6% of employed population)
One of America’s most reliable labor strongholds, Washington state saw its membership rolls rise by more than 10% in 2019 as unions across the state added tens of thousands of new members. Among the recent legislative accomplishments attributed to union activism in Washington are a $15 minimum wage, paid sick leave, and paid medical and family leave.
48 / 51Canva
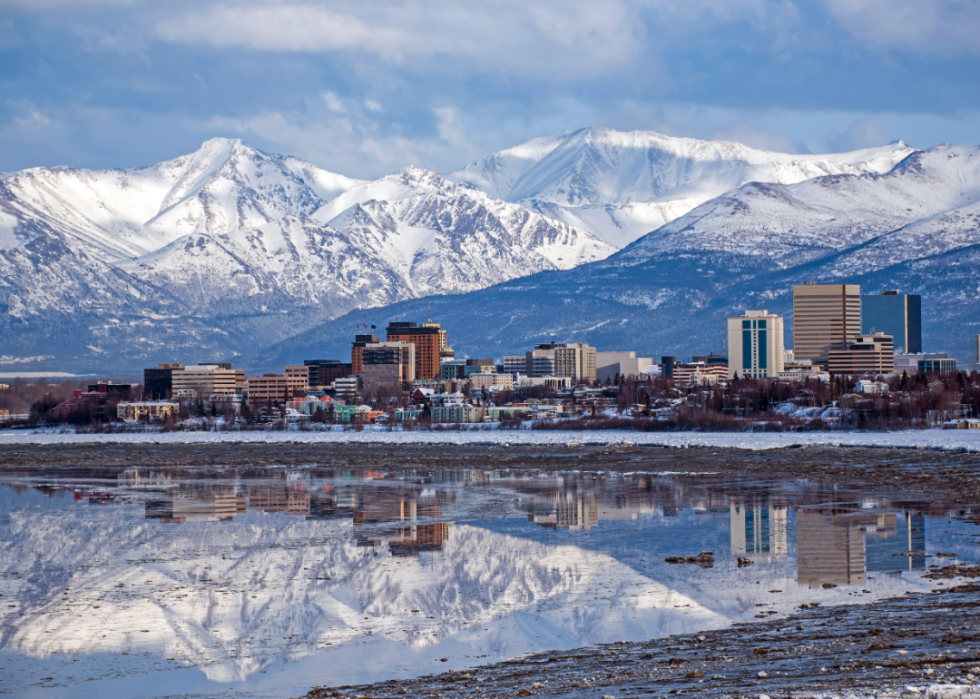
#4. Alaska
– Employed population: 280,000
– Members of unions: 49,000 (17.7% of employed population)
– Workers represented by unions: 55,000 (19.5% of employed population)
Iowa’s recertification law is hardly the only example of anti-union legislators erecting unnecessary legal barriers making it harder to join a union, to recruit new union members, and to stay within the state’s regulations. In Alaska, for example—a state with a long history of labor solidarity—the governor is pushing for a new rule that would force union workers to opt in to their unions every year.
49 / 51Will Hart // Flickr
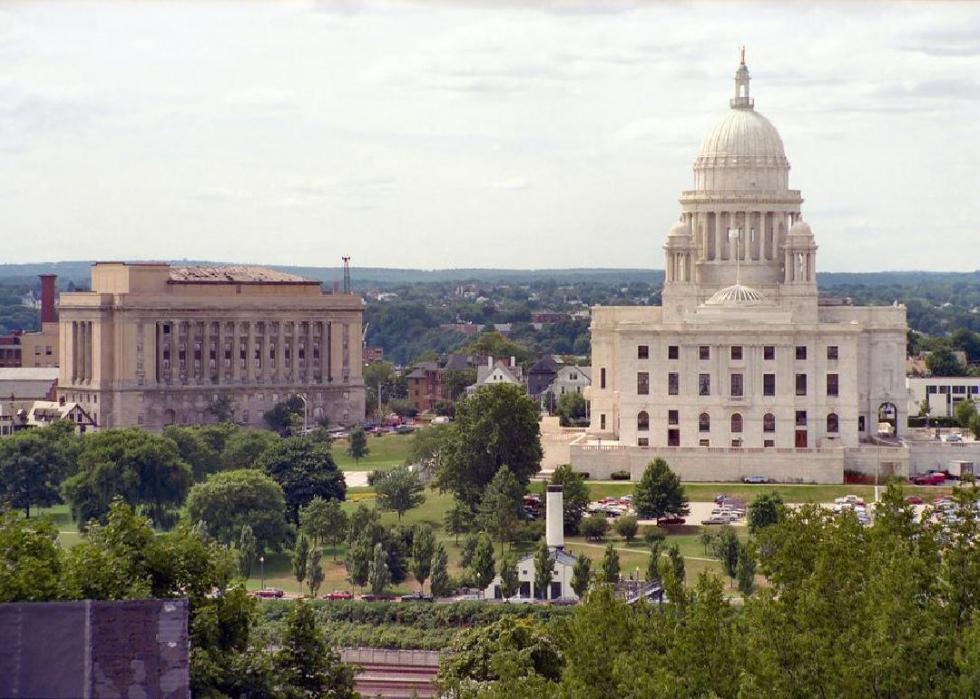
#3. Rhode Island
– Employed population: 455,000
– Members of unions: 81,000 (17.8% of employed population)
– Workers represented by unions: 87,000 (19.1% of employed population)
Although tiny in size, Rhode Island boasts one of America’s five biggest union membership rolls in terms of the percentage of employee population—and it’s also home to some of organized labor’s oldest and richest history. The forerunners to Rhode Island’s first unions emerged in the early 1750s, before America was even a country.

50 / 51Canva
#2. New York
– Employed population: 7.6 million
– Members of unions: 1.7 million (22.0% of employed population)
– Workers represented by unions: 1.8 million (23.6% of employed population)
New York stands with California as the only two states left with seven-figure union membership rolls. From the Brooklyn Bridge and the Empire State Building, to the network of subterranean tunnels that carry millions of New Yorkers on the city’s subway system every day, the evidence of New York City’s industrial heritage is literally everywhere you look. But it’s not just the big city—unions have contributed to every facet of the labor, politics, and social fabric across the state.
51 / 51Izabela23 // Shutterstock
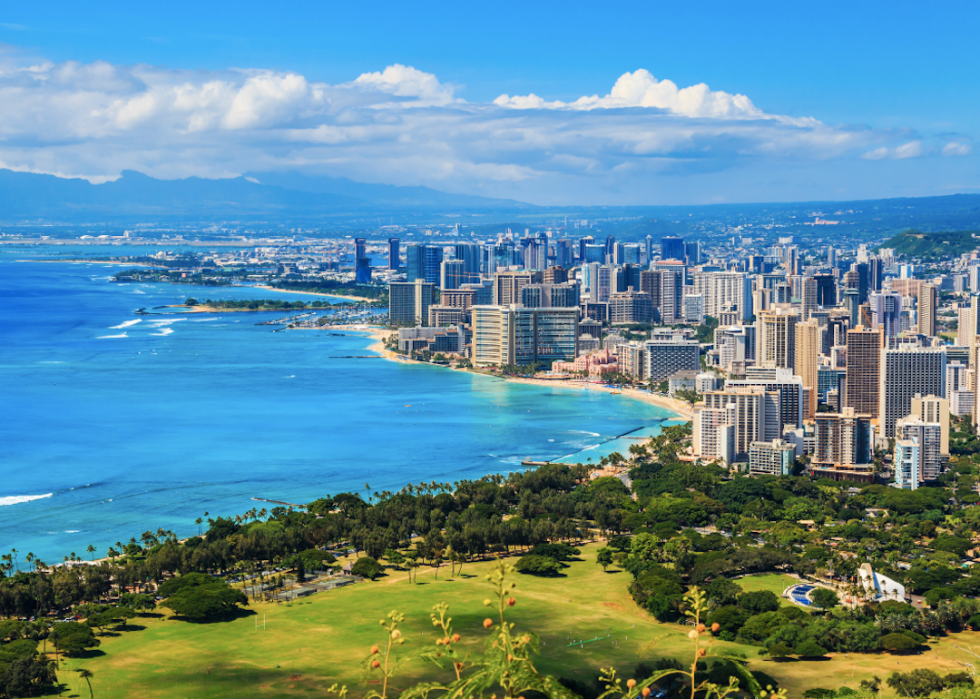
#1. Hawaii
– Employed population: 508,000
– Members of unions: 120,000 (23.7% of employed population)
– Workers represented by unions: 130,000 (25.7% of employed population)
Only two states can still boast union membership of more than 20% of their working population—New York and Hawaii. The island chain’s early statehood witnessed labor uprisings largely organized by race among laborers toiling in what was then the state’s sugar plantation system. Once workers united and formed one single union, however, organized labor grew deep roots in the state, and Hawaii continues to be America’s foremost union state.


